Download
1 / 30
300 likes | 306 Views
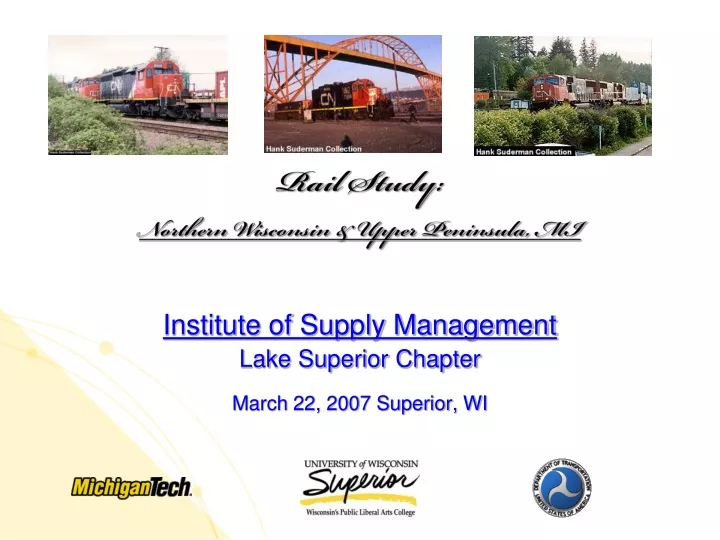
Rail Study: Northern Wisconsin & Upper Peninsula, MI. Institute of Supply Management Lake Superior Chapter March 22, 2007 Superior, WI. Presentation. Research Team Rail and other transportation trends Rail developments in the study area

E N D
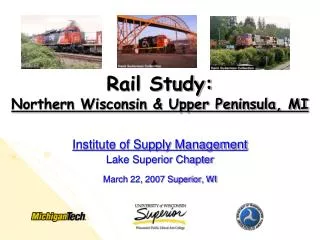
Rail Study: Northern Wisconsin & Upper Peninsula, MI Institute of Supply Management Lake Superior Chapter March 22, 2007 Superior, WI
Presentation • Research Team • Rail and other transportation trends • Rail developments in the study area • Northern Wisconsin and Upper Peninsula of Michigan Rail Study • Study activities • Conclusions and Recommendations
Growing Rail Freight: Tools for ShippersResearch Team • University of Wisconsin – Superior: Transportation and Logistics Research Center • Richard D. Stewart, Ph.D. • Xiubin Wang, Ph.D. • William Bajjali, Ph.D. • Libby Ogard, MBA (Prime Focus) • Michigan Technological University: Dept. of Civil and Environmental Engineering,Railroad Engineering Program • William J. Sproule, Ph.D. • Pasi T. Lautala, Ph.D. candidate • Student Researchers from UW-Superior and Michigan Tech • Acknowledgments • CN Railroad and short line railroads • Shippers and shipper associations • Wisconsin and Michigan DOTs • Economic Development Agencies in the Region
Current State of Truck and Rail Transportation Network • Rail and truck capacity becoming tight for the first time since 1979 • Rate rising for both modes • Trucking industry is using rail for intermodal • Coal and grain resurgence • Industrial products are outpacing US GNP • Long lead time for rail infrastructure improvements
Ton Miles per Mile of Track Ton Miles Vehicle Miles Traveled (VMT) Track Miles VMT Per Lane Mile Source: USDOT, National Transportation Statistics Lane Miles Trucks on Road, 1999 - 2003 Class 1 Railroad Cars, 1960-2000 DOT AASHTO ATA Transportation Trends • Increase in volumes • Decrease in: • Infrastructure capacity • Equipment
Source: Surface Transportation Board Source: U.S. Census Bureau; AAR Railroad Trends • Long period of inadequate Return On Investment (ROI) • Record profits and investments in 2006 • Most capital intensive industry • ~15% of capital spending for new capacity • Raising costs • Concentration on main corridors
Class 1 Railroad Cars 1960 – 1,658,292 1980 – 1,168,114 1990 - 658.900 2000 – 560,154 Net loss 1,098,138 cars Short Line Railroad Cars 1960 – 32,114 1980 – 102,161 1990 - 103,527 2000 – 132,448 Net Gain 100,334 cars Declining Rail Car Capacity Overall the rail industry has lost 997,904 rail cars in past 40 years. (BTS 2003) New rail cars have more capacity per car, 1 rail car > 3 Semi-trucks. Railroads have improved use of cars… but fewer cars = less system versatility and resilience to handle smaller markets
Productivity Increases Volume Staggers Act Passed Oct. 1980 Revenue Price U.S. Railroad Performance: 1964-2002(Index 1981 = 100) Source: AAR
Two Scenarios:1) Downward Spiral Lower rail volumes Rail Carriers Shippers Service deterioration
Research DOT MRUTC EDA Univ. Others 2) Upward Spiral? Higher rail volumes Rail Carriers Shippers Co-operation Increased investments and service
Northern Wisconsin and UP Michigan Rail Study - Background • Federally funded rail study • Initiated by regional shippers and economic development agencies • Dissatisfaction and concern for continuing rail service in the region • Transfer from regional to national carrier • Commodity mix • Shipping quantities • Diversion of rail traffic to other modes
Objectives and Methodology • Objectives: • Find methods to increase regional shippers’ use of rail services • Create potential for regional economic benefits and growth • Methodology: • Practical approach • Collect stakeholder input • Encourage cooperation between groups • Identify and develop beneficial tools and processes
Growing Rail Freight Study: Action Plan • Evaluate rail infrastructure and hold Stakeholder meetings • Assess the current rail service and condition of rail lines • Share ideas for addressing concerns – communicate • Shipper/carrier/government associations • Develop new or expand existing associations • Survey to ascertain rail issues • Examine possible solutions and recommendations based on findings • Develop data base of supply chain providers and other support business • Catalog and disseminate companies and education programs • Create Model of Rail Development GIS System • Stimulate future and expanded rail usage • Regional economic development
Preceded by interviews with Rail and Shippers Shippers, Rail, Government Agencies active participants 9 meetings at 8 locations Research team an impartial facilitator Power Point presentations Questions & answers Open dialog Shipper Meetings
Stakeholder Meeting Outcomes • 171 participants total • Well received • Public environment to present viewpoints • Presentations enabled to validate trends • Direct communication between Carriers, DOTs, EDAs and shippers • Benefits for research team • Adjusting and reprioritizing study activities • Encouragement to participate in shipper survey • Organizing additional communication opportunities • Immediate outcomes in log transportation • More focus on railroads in transportation discussion
Findings • Inadequate data • Current rail facilities • Future demand & supply • Challenging to motivate stakeholder participation • Limited understanding of rail industry and operations • Only negative publicity sees daylight • Need to improve communications and information transfer • Education – Rail User Tool Kit
Action Item III:Survey to ascertain rail issues 43 Companies Responded Question 24: If you are unable to provide a back haul shipment for the carrier making a delivery to you, do you coordinate with other local companies to provide a back haul for the carrier?
Action Item IV Develop tools and database of supply chain managers and other transportation support business • Catalog and disseminate third party provider companies and education programs • Work with extension offices to set up programs • Provide model of rail costing decision tool for shippers Resulted in the “Rail User Tool Kit”
Rail User Tool Kit • Includes information on: • Getting started • Equipment and investments • Resources • Case study of a new user • Copies available: • In the printed report • On the CD-ROM • Online: www2.uwsuper.edu/trans
Action Item V Create Model of Rail Development GIS System • Stimulate future and expanded rail usage • Regional economic development tool • Modeled on proven systems in other states • Pennsylvania Rail Freight Properties Directory • Online at: http://www.dot.state.pa.us/
Rail DevelopmentGeographic Information System (GIS) • Purpose: • Identify properties along or near existing railroads that have the potential to be rail served • Act as a central storehouse – so all parties could easily access pertinent information • Present the relevant information in an easy-to-use, convenient, and graphic-rich way • Internet-based GIS system was selected • Reach the largest possible audience • Ease of use, familiar online tools • Utilize the latest IT methods
GIS Focus Area: • 3 GIS base maps were used as a starting point – 2 commercial ones, and WisDOT data • About 120 sites were identified and examined • Teams of student researchers went out in the field to verify what rail sidings and spurs actually existed or did not exist Ashland Subdivision • Over 60% of the sidings & spurs in this area were found to have significant discrepancies compared to base maps Ladysmith - to - Rhinelander section
The only useable track in the whole area How Bad Can It Be…?
Base maps indicate the purple-shaded track: We found that these two sidings no longer exist at all… …and these sidings and spurs do exist, but are not shown at all on the base maps. Example: Town of Mellen
Rail Study: an Education Process • Student involvements: • Graduate student at Michigan Tech • PhD candidate studying railway issues • Undergraduates at UW Superior • More than 10 undergraduate students in the new Transportation and Logistics major were involved • Students learned GPS and GIS applications, data analysis, and general transportation planning and operation in relation to regional economy • Students participated in work report preparation, editing, and field tours
Conclusions • Stakeholder meetings effective forum to educate and discuss issues • Importance of multi-way facilitated communications • New as well as current customers vital to rail health - • Rural areas with natural resource based economies dependent on rail service • Rail service in Northern Wisconsin and UP Michigan can not be taken for granted
Recommendations • Improve communications – Long and short term plans for carriers and shippers • Rail Carriers expand outreach to seek customer input • Tools are needed to support Supply Chain Management • Support shipper’s and rail carriers interaction with regional communities • Formally recognize the external costs of transportation • Explore the feasibility of adding Transload Centers • Shortline or regional railroad options • Promote economic development by enhancing rail access
UW-Superior Website: Tool Kit and Studywww2.uwsuper.edu/trans Thank You! Questions?