Download
1 / 16
160 likes | 301 Views
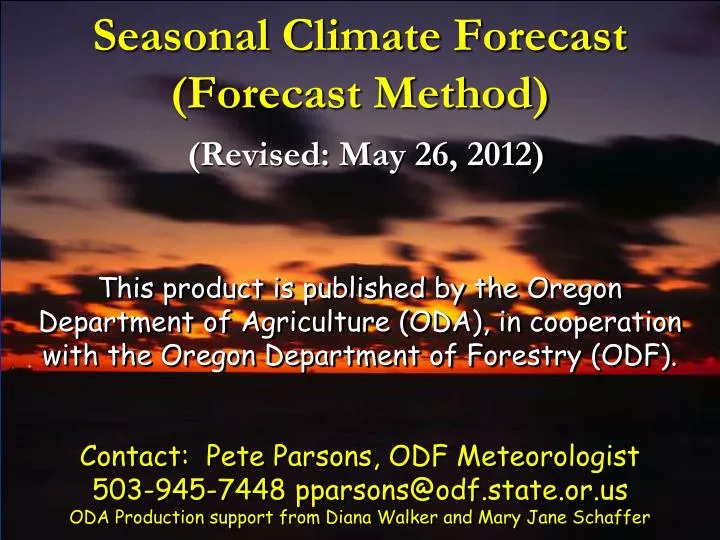
Seasonal Climate Forecast (Forecast Method) (Revised: May 26, 2012). This product is published by the Oregon Department of Agriculture (ODA), in cooperation with the Oregon Department of Forestry (ODF). Contact: Pete Parsons, ODF Meteorologist 503-945-7448 pparsons@odf.state.or.us

E N D
Seasonal Climate Forecast (Forecast Method)(Revised: May 26, 2012) This product is published by the Oregon Department of Agriculture (ODA), in cooperation with the Oregon Department of Forestry (ODF). Contact: Pete Parsons, ODF Meteorologist 503-945-7448 pparsons@odf.state.or.us ODA Production support from Diana Walker and Mary Jane Schaffer
Seasonal Climate Forecast (Forecast Method) • Find Past Years With Similar Characteristics (Analog Years). • Find Common Events or Trends During Those “Analog Years.” • Use That Information to Predict Future Events and/or Trends.
What About Climate Change? • The assumption is made that no climate change has occurred from the time of the analog years to present. • Since the climate is constantly changing, it is understood that this assumption adds to forecast error. • Forecast verification shows that this method still outperforms climatology.
How Are “Analog Years” Picked? • Top analog years are identified based on sea-surface temperature (SST) patterns across the Pacific Ocean. • Current and historical records of the Southern Oscillation Index (SOI), Oceanic Niño Index (ONI), and Pacific Decadal Oscillation (PDO) are analyzed to find past years with similar characteristics to the current year.
Southern Oscillation Index (SOI) • An index calculated based on the differences in air pressure anomaly between Tahiti and Darwin, Australia. • Strongly related to temperature changes in the tropical Pacific Ocean.
SOI is Based on Pressure Anomalies of Two Sites Darwin Tahiti
Oceanic Niño Index (ONI) • Based on SST departures from normal in the Niño 3.4 region • Defined as the three-month running-mean SST departure for normal.
NOAA Operational Definitionsfor El Niño and La Niña areBased on the ONI • El Niño: characterized by a positive ONI greater than or equal to +0.5°C. • La Niña: characterized by a negative ONI less than or equal to -0.5°C. • To be classified as a full-fledged El Niño or La Niña episode these thresholds must be exceeded for a period of at least 5 consecutive overlapping 3-month seasons. • CPC considers El Niño or La Niña conditions to occur when the monthly Niño3.4 SST departures meet or exceed +/- 0.5°C along with consistent atmospheric features.
El Niño / Southern Oscillation(ENSO) • Year-to-year variations in sea-surface temperatures, convective rainfall, surface air pressure, and atmospheric circulation across the equatorial Pacific Ocean. • El Niño and La Niña represent opposite extremes in the ENSO cycle.
Warm Event Cold Event
Pacific Decadal Oscillation (PDO)(Fluctuations in the Northern Pacific Ocean SSTs) Warm Phase Cool Phase Courtesy: http://jisao.washington.edu/pdo/
Pacific Decadal Oscillation (PDO)(Highlights) More frequent and stronger El Niño events occur during periods dominated by the “Warm Phase.” More frequent and stronger La Niña events occur during periods dominated by the “Cool Phase.” In 2007, we apparently transitioned back into the “Cool Phase.”
Pacific Decadal Oscillation (PDO)(Each Phase Typically Lasts for 20-30 Years) Cool Phase Dominates (1890-1924) Warm Phase Dominates (1925-1946) Cool Phase Dominates (1947-1976) Warm Phase Dominates (1977-2006) Cool Phase (2007-?) Data Courtesy: http://jisao.washington.edu/pdo/img/pdo_latest.jpeg
Seasonal Climate Forecast(Forecast Method) Your Feedback is Welcome Contact: ODF Meteorologist Pete Parsons at 503-945-7448 pparsons@odf.state.or.us