Download
1 / 46
490 likes | 675 Views
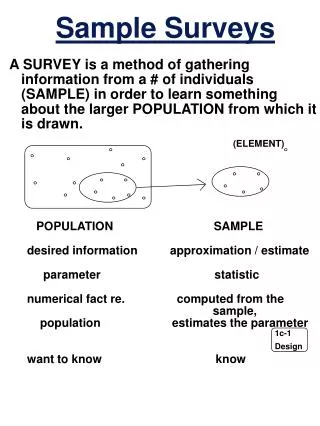
Sample Surveys. Sample vs. Population. We must be able to stretch from the sample at hand to the population at large: We need this for business decisions, election polling, scientific experiments, choosing investments….

E N D
Sample vs. Population • We must be able to stretch from the sample at hand to the population at large: • We need this for business decisions, election polling, scientific experiments, choosing investments… • We cannot make this leap without understanding statistics and three big ideas
Idea 1 – Examine a Part of the Whole • We want to “draw a sample” • We want to know about an entire population of individuals, but this might be impractical if not impossible • Instead we settle for examining a smaller group of individuals – a sample – selected from the population. • A sample survey is a set of questions designed to be asked to a small group of people in the hope of learning something about the entire population
Bias Selecting a sample to represent the population fairly is more difficult than it sounds. Sampling methods that, by their nature, tend to over- or underemphasize some characteristics of the population are said to be biased • Conclusions drawn from this biased methods are inherently flawed. • There is usually no way to fix bias after the sample is drawn and no way to salvage useful information from the collected data.
Bias and Modern Polling • How do modern polls get their sample to represent the entire population? • They select individuals to sample at random. • The importance of using randomness is one of the great insights of statistics.
Idea 2 - Randomize • Think about tasting a “sample” of soup from the entire “population” of the cooking pot. • Imagine you add some salt to the pot • If you sample it before stirring, you’ll get the misleading idea that the whole pot is salty • Sample it from the bottom, you’ll get an equally misleading idea that the whole pot is bland. • By stirring, you randomize the amount of salt throughout the pot. • Now each taste is more typical of the whole pot.
Randomize • Randomizing also helps against unknown factors: • Your jerk of a friend ads peas to your perfectly good soup while you aren’t looking. • By stirring the salt, you also randomize the peas, too, making your sample more typical of the overall pot even though you didn’t know the peas were there! • How do we “stir” people in a survey? • We select them at random! • Randomizing protects us from the influences of all the features of our population by making sure that, on average, the sample looks like the rest of the population.
Idea 3 – It’s The Sample Size • How large a random sample do we need for the sample to be reasonably representative of the population? • You might think we need a large percentage or fraction of the population. • But, it turns out what matters is the number of individuals in the sample and NOT the size of the population. • A sample of 100 students in a college represents the student body just about as well as a random sample of 100 voters represents the entire electorate of the United States!
Sample Size Is What Matters • Does this make intuitive sense? • Perhaps if we try going back to our soup example: • If you are cooking soup enough for your family versus for a banquet, do you need a bigger spoon to decide if the soup is ready? • Of course not! • The fraction of the population you sampled doesn’t matter, it’s the sample size that is important. • (except for very small populations)
Does a Census Make Sense? • Why bother determining the right sample size? • Why not just “sample” the entire population? • Such a special sample is called a census • There are a number of reasons why a census may not provide the best possible information:
Census • It can be difficult to complete a census • Some individuals in the population will be difficult or expensive to locate • A census might be impractical – the now bankrupt twinkie company wouldn’t want to census all of its twinkies for quality control – they would have none left to sell. • Populations rarely stand still – a census takes a long time to complete and by the time it is done things may have changed. • Census taking may also be more complex – the US Census tends to record too many college students because many are counted twice – once at home and once for the school’s report
Populations and Parameters • Models use mathematics to represent reality • Parameters are the key numbers in those models • A parameter used in a model for a population is sometimes redundantly called a population parameter • We use summaries of the data to represent the population parameters. • Any summary found from the data is a statistic • Two parameters from chapter 6:
Parameters We draw samples because we can’t work with the entire population but we want the statistics we compute from a sample to reflect the corresponding parameter accurately. A sample that does this is said to be representative
Just Checking • Why is each of the following claims not correct? It is always better to take a census than to draw a sample It can be hard to reach all members of a population, and it can take so long that circumstances change, affecting the responses. A well-designed sample is often a better choice.
Just Checking • Stopping students on their way out of the cafeteria is a good way to sample if we want to know about the quality of the food there. • The sample is probably biased – students who didn’t like the food at the cafeteria might choose not to eat there.
Just Checking • We drew a sample of 100 from the 3000 students in a school. To get the same level of precision for a town of 30,000 residents we will need a sample of 1000 • Only the sample size matters, not the fraction of the overall population. • A poll taken at a statistic support website garnered 12,357 responses. The majority said they enjoy doing statistics homework. With a sample size that large we can be pretty sure that most statistics students feel this way, too. • Students who frequent this website might be more enthusiastic about stats than the overall population of stat students. A large sample cannot compensate for this bias.
Just Checking • The true percentage of all Stat students who enjoy the homework is called the “population statistic” • It’s the population “parameter.” “Statistics” describe the samples.
Simple Random Samples • How do we select a representative sample? • Every individual in the population should have an equal chance of being selected • This is fair but not sufficient • Example: A school of 200 has 100 males and 100 females. We could sample like this: Flip a coin. If it comes up heads, select 100 female students at random. If it comes up tails, select 100 male students at random • Everyone has an equally likely chance of being selected, but every sample is of only a single sex – not representative.
Simple Random Samples • We must do better! • We must insist that every possible sample of the size we plan to draw has an equal chance of being selected. • Each combination of people has an equal chance of being selected as well. A sample drawn in this way is called a Simple Random Sample (SRS)
Simple Random Sample • To select a sample at random first we define where the sample will come from: • The sampling frame is a list of individuals from which the sample is drawn • Example: • To draw a random sample of students at a college, we might obtain a list of all registered full-time students and sample from that list. • In the defining the sample frame we must deal with the details of defining the population. Are part time students included? How about those who are transferring credits?
Simple Random Sample • Once we have a sampling frame the easiest way to choose an SRS is to assign a random number to each individual in the sampling frame. • We then select only those whose random numbers satisfy some rule (chapter 11 ahead) • Example: • There are 80 students enrolled in an Intro. Stat. class. You are to select a sample of 5 • Q: How can you select an SRS of 5 using these random digits found on the internet: 05166 29305 77482 • First, number the students 00 through 79. Take the random numbers two digits at a time: 05 16 62 93 05 77 48 Ignore 93 because students only numbered through to 79 and to not pick the same person twice ignore the repeated 05. My simple random sample consists of students with the numbers 05, 16, 62, 77, 48
Random Number Sampling Rules • When we are choosing a larger sample from a sampling frame stored in a data file we can first assign a random number with several digits (say, 0 to 10,000) to each individual. Then we arrange the random numbers in numerical order, keeping each name with its number. Choosing the first n names from this re-arranged list will give us a random sample of that size • Often the sampling frame is so large that it would be too tedious to number everyone consecutively. If our intended sample size is approximately 10% of the sampling frame, we can assign each individual a single random digit from 0 to 9. Then we select only those with a specific random digit, say, 5.
Simple Random Samples • Samples drawn at random generally differ one from another. Each draw of random numbers selects different people for our sample. These differences lead to different values for variables we measure. We call these sample-to-sample differences sampling variability. • Sampling variability isn’t a problem! • It is an opportunity… • In future chapters we investigate what the sample-to-sample variability can tell us about this population
Stratified Sampling • Sometimes more complicated designs may save time or money or help avoid sampling problems • The thing all statistical sampling designs have in common is the idea that chance, rather than human choice, is used to select the sample • Designs used to sample from large populations, especially populations residing across large areas – are often more complicated than simple random samples • Sometimes the population is sliced into homogenous groups, called strata before the sample is selected • The SRS is used within each stratum before the results are combined. This common sampling design Is called stratified random sampling
Stratified Sampling • Example: • We want to learn how students feel about funding for the football team at a large university • The campus is 60% men, 40% women • We suspect men and women have different views on funding • If we use simple random sampling to select 100 people from the survey we could end up with 70 men and 30 women or 35 men and 65 women. • Our resulting estimate of the level of support for funding the football team could vary widely • To help reduce this sampling variability we can decide to force a representative balance, selecting 60 men at random and 40 women at random. • This would guarantee that the proportions of men and women within our sample match the proportions in the population, thus ensuring that the samples more accurately reflect the population opinion.
Stratified Sampling • You can imagine the importance of stratifying by race, income, age, and other characteristics • Samples taken within a stratum vary less, so our estimates can be more precise • The reduced sampling variability is the most important benefit to stratifying.
Stratified Sampling Example • You are trying to find out what freshmen think about the food served on campus. Food Services believes that men and women typically have different opinions about the importance of the salad bar • Q: How would you adjust your sampling strategy to allow for this difference? • A: Stratify the sample by drawing an SRS of men and a separate SRS of women – assuming that the data from the registrar include information about each person’s sex.
Cluster and Multistage Sampling • Suppose we wanted to assess the reading level of our stat textbook based on the length of the sentences. • Simple random sampling could be awkward; we’d have to number each sentence, and so on. Doesn’t sound like fun! • It would be much easier to pick a few pages at random and count the lengths of sentences on those pages. • That works if we believe that each page is representative of the entire book in terms of reading level.
Cluster and Multistage Sampling • Splitting the population into representative clusters can make sampling more practical. • Then we could simply select one or a few clusters at random and perform a census within each of them. This sampling design is called cluster sampling. • If each cluster represents the full population fairly, the sampling will be unbiased • Example: • In trying to find out what freshmen think about food on campus you have considered both an SRS and a stratified sample. • Now you run into a problem: It is simply too difficult and time consuming to track down the individuals whose names were chosen for your sample. Fortunately, the freshmen at your school are housed in 10 freshmen dorms!
Cluster Sampling Example • …Freshmen all in 10 dorms • How could you use this fact to draw a cluster sample? How might that alleviate the problem? What concerns do you have? • Select one or two dorms at random and then try and contact everyone in each selected dorm. • You could save time by simply knocking on doors on a given evening and interviewing people. You would have to assume that freshmen were assigned to a dorm pretty much at random and that the people I am able to contact are representative of everyone in the dorm.
Stratified vs. Cluster • We stratify to ensure that our sample represents different groups in the population • We then sample randomly within each stratum • Clusters are internally heterogeneous, each resembling the overall population. • We select clusters to make sampling more practical or affordable
Stratified v. Cluster • Say you want to taste test a boston cream pie • Two approaches: • Take a vertical slice out of the pie that captures each layer – this vertical slice would be a cluster sample
Stratified v. Cluster • OR • Sample the strata: • Select some tastes of the cake at random, some tastes of the cream at random, and some bits of the frosting at random. This is a stratified sampling.
Multistage Samples • Sometimes we use multiple sampling methods at once: • Say you wanted to assess the reading level of the textbook but were concerned that as the book went on the reading became gradually more difficult • You might randomly choose one chapter from each of the seven parts of the book and then randomly select a few pages from each of those chapters. If there are still too many sentences we may then select a few sentences from each of those pages. • What is the sampling strategy? • First, we stratify by the part of the book and randomly choose a chapter to represent each stratum. Within each selected chapter, we choose pages as clusters. Finally, we consider an SRS of sentences within each cluster
Example • Having learned that freshmen are housed in separate dorms allowed you to sample their attributes about the campus food by going to dorms chosen at random, but you’re still concerned about possible differences in opinions between men and women. It turns out that these freshmen dorms house the sexes on alternate floors. • How can you design a sampling plan that uses this fact to your advantage? • Now you can stratify your sample by sex. First choose one or two dorms at random and then select some dorm floors at random from among those that house men and, separately, from among those that house women. Treat each floor as a cluster and interview everyone on that floor.
Systematic Sampling Example • Reading Level of Book: • Chosen a chapter of the book at random, then three pages at random from that chapter, and now we want to select ten sentences from the 73 found on those pages • Instead of numbering each sentence so we can pick a SRS, it would be easier to sample systematically. • 73/10 = 7.3 • We can get out sample by picking every seventh sentence on the page. • Where should you start? At random! • We have accounted for 70 of the sentences (7 x 10), so we throw in the extra 3 into the starting group and choose a sentence at random from the first 10. Then we pick every seventh sentence after that and records its length.
Systematic Samples • Some samples select individuals systematically • Perhaps you survey every tenth person on an alphabetical list. To make it random, you must start the systematic selection from a randomly selected individual • When the order of the list is not associated in any way with the responses sought, systematic sampling can give a representative sample
Just Checking! • We need to survey a random sample of 300 of the passengers on a flight from San Francisco to Tokyo. Name each sampling method described: • 1) Pick every 10th passenger as people board the plane • Systematic • 2) From the boarding list randomly sample 5 people flying first class and 25 of the other passengers • Stratified
Just Checking! • We need to survey a random sample of 300 of the passengers on a flight from San Francisco to Tokyo. Name each sampling method described: • 3) Randomly generate 30 seat numbers and survey the passengers who sit there • Simple • 4) Randomly select a seat position (right window, right center, right aisle, etc.) • Cluster
The Valid Survey • A valid survey yields the information we are seeking about the population we are interested in: • Before setting out to survey, ask yourself: • What do I want to know? • Am I asking the right respondents? • Am I asking the right questions? • What would I do with the answers if I had them; would they address the things I want to know?
Pitfalls to Avoid: • Know what you want to know! Have a clear idea of what you hope to learn and about whom you hope to learn it. • Use the right frame. Be sure you have an appropriate sampling frame: have you identified the population of interest and sampled from it appropriately?
Pitfalls to Avoid • Tune Your Instrument. Be aware of asking questions you do not really need – longer questionnaires yield fewer responses and thus a greater chance of nonresponse bias • Ask specific rather than general questions. People are not good at estimating their typical behavior: Better to ask “how many hours of sleep did you get last night” rather than “how much sleep do you usually get?”
Pitfalls to Avoid • Ask for quantitative results when possible: How many magazines did you read last week? Rather than How much do you read: A lot, A moderate amount, A little, None at all • Be careful in phrasing questions: A respondent may not understand the question or may understand the question differently than the researcher intended it. Respondents may even lie or shade their responses if they feel embarrassed by the question.
Pitfalls to Avoid 53% of respondents approved to the first phrasing, but with the second phrasing it was only 46% • Subtle differences in phrasing can make a difference: • “After 9/11, President Bush authorized government wiretaps on some phone calls in the US without getting court warrants, saying this was necessary to reduce the threat of terrorism. Do you approve or disapprove of this?” • “After 9/11, George W. Bush authorized government wiretaps on some phone calls in the US without getting court warrants. Do you approve or disapprove of this?”
Pitfalls to Avoid • Be careful in phrasing answers: It is often a good idea to offer choices rather than inviting a free response. Open-ended answers can be difficult to analyze • A pilot is a trial run of the survey you eventually plan to give to a larger group, using a draft of your survey questions administered to a small sample drawn from the same sampling frame you intend to use.
Homework Page 288, #5,6 17,18,23, 25, 29