Download
1 / 51
540 likes | 582 Views
Multivariate Data Analysis for Metabolomics Data generated by MS / NMR Spectroscopy. Metabolomics Workshop Research Triangle Park / NC July 14th-15th H. Thiele, Bruker Daltonik, Bremen. Why do Metabolic Profiling ?. Clinical Diagnostics

E N D
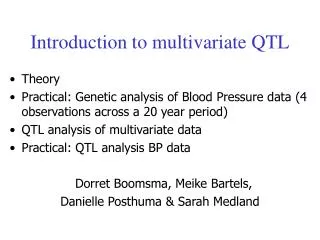
Multivariate Data Analysis for Metabolomics Data generated by MS / NMR Spectroscopy Metabolomics Workshop Research Triangle Park / NC July 14th-15th H. Thiele, Bruker Daltonik, Bremen
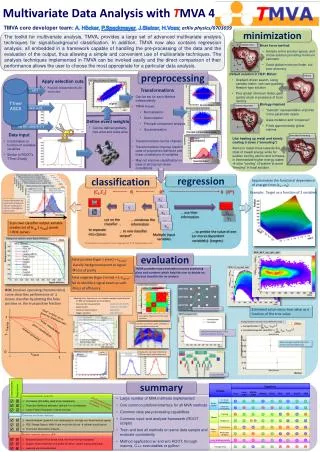
Why do Metabolic Profiling ? Clinical Diagnostics • find metabolic markers for disease progression (e.g. cancer) • diagnose inborn errors or other diseases • study of genetic differences Toxicology • markers for drug toxicity and drug efficacy • analyze time course of toxicological response Food Science • quality control / classification of origin • health/flavor enhancement of agrochemical products MS + NMR together: • Parallel Statistics >> more confidence • Hyphenation >> ultimate characterization tool
Fundamental Issue in MVS: Dimension Reduction Bucketing • several bucketing techniques for optimum design of variables
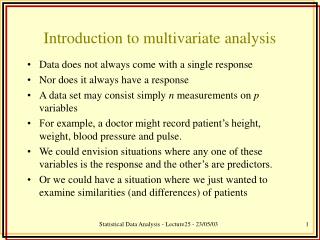
Dynamic Peak Bucketing Scheme a1 a2 a3 a4 a5 a1 a2 a3 a4 a5 a10 a2 a30 a4 a5 b1b2 b3 0 b4 b5 b6 00 a1 0 a2 a3 0 a4 a5 00 b1 b2 b3 0 b4 b5 b6 c1c2 c3 0 0 c4 c5 c6 0 b1b2 b3b4 b5b6 c1c2c3 c4c5 c6 Spectra are bucketed one by one Bucket table gets a new column whenever a new peak occurs Spectra not having peaks at new positions get corresponding 0
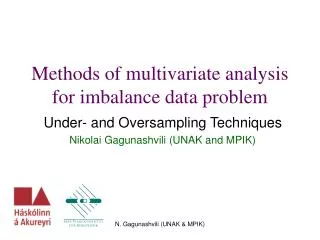
767.0 373.2 Intensity m/z 800 100 673.1 471.1 615.3 700 538.2 100 600 100 500 m/z 336.3 400 283.2 0.3 Da 100 203.0 300 10s 166.1 200 1Da 30 100 100 50 m/z Intensity 100 60s Time [s] Time Kernel Bucketing for LC-MS Data Bucketing Parameter e.g. m/z bucket width = 1, Kernel 0.3 Da Time bucket width = 60s, Kernel 10s LC-MS chromatograms of N samples Bucketing Intensity Table of N samples
Which Bucketing Technique to be used ? • Rectangular, equidistant bucketing standard, good compromise if no a priori knowledge • Variable sized bucketing makes shifts ineffective, allows selective usage • Point wise bucketing often used for broad line spectra as a special case of rectangular, equidistant bucketing • Dynamic peak bucketing allows very fine bucketing without getting huge tables, requires stable shifts or masses • Kernelized bucketing variant of rectangle bucketing to reduce effect of shifts
Data Preprocessing : Spectral Background Subtraction Measured Data are contaminated by solvents and chemical noise Intensity of contaminants may dominate the relevant data Chemical Noise Solvent at m=75.2, Baseline and Scaled Noise Estimate Detection of Traces by dynamic grouping
Data Preprocessing : Spectral Background Subtraction Subtraction of spectral background makes relevant data visible Hidden traces of m=180.2 and m=208.2 in BPC Intensity Base Peak Chromatogram (BPC) before and after Background Subtraction time Intensity Visible traces of m=180.2 and m=208.2 inBPC time Intensity time
Peak Picking Tasks Find compounds defined by RT, m/z, z and area Take together isotopic peaks and charge states
NMR or MS = sensor LC-MS chromatogram or NMR spectrum= fingerprint - healthy / non-healthy - high / low quality Multivariate Statistics in Metabolomics Spectroscopy How to analyze large numbers of complex LC-MS chromatograms or NMR spectra with the target of simple discrimination or grouping? Use Pattern Recognition Techniques!
Pattern Recognition (PR) Objectives of PR: • Statistical characterization • Model building • Classification Methods of PR: Exploratory Data Analysis • Statistical Tests • Principle Component Analysis (PCA) >> variance analysis Unsupervised Pattern Recognition • Cluster Analysis Supervised Pattern Recognition • Discriminant Analysis: LDA, PCA-DA • Classification of samples by various means e.g. Genetic Algorithm, SVM, …
y y x x PC3 PC2 y y PC1 x x e.g. Principal Component Analysis Idea of Principal Component Analysis (PCA)
Classification using PCA Input classification model spectra list Bucketing coordinate transformation distance measures comparison to critical values
Coordinate Transformation ppm1 ppm2 PC2 PC1 Loadings Scores
Baby Urine Samples : PCA - NMR mevalonic aciduria orotic aciduria maple syrup disease 200 normal candidates PC 1,2 Pattern in PC1/PC2 scores plot reveals candidates with inborn errors.
New Born Screening by NMR > 400 baby urines, PCA, disease vectors indicating strength of metabolic disorders PC1/PC2 PC11/PC12 PC3/PC4 Bucket Analysis from 9 to 0.4ppm in 0.04ppm steps Excluded: 6 to 4.5 ppm residual water and urea Results of BEST-NMR at 600 MHz 1D-spectra Noesy presat 64 scans 6c 6
New Born Screening by NMR Distance from normals distribution is a measure for concentration of the molecule representing an inborn error Hippuric acid vector CH2- group of hippuric acid 4c 4
PC2-Scores PC1-Scores PCA : NMR vs. LC-MS Fig. 1: Scores plot of NMR data from baby urines (born 2003). Fig. 2: Scores plot of LC-MS data from a subset of baby urines (born 2003).
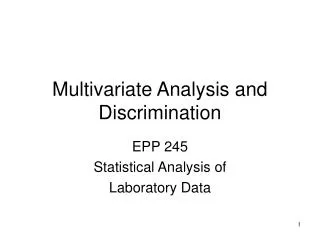
8 8 6 6 4 4 -MS, 5.5-6.8min 263.1037 2 Measured Pattern 2 0 0 264.1062 C13 H15 N2 O4 ,263.10 263.1037 Calculated Pattern 264.1068 260 261 262 263 264 265 266 267 m/z 2 4 6 8 t [min] Generate Molecular Formula of mass 263.1037 m/z @ 5.9min. LC-MS data of Samples 114 and 94 Sample 114 BPC: -All MS Sample 94 BPC: -All MS Intensity * 104 8 eXpose 94 vs. 114 BPC: -All MS 263.1 6 4 2 0 The determined formula C13H15N2O4 corresponds to phenyl-acetylglutamate.
Combining Spectra and Statistical Data Interpretation scores / loadings Loadings in PCA indicate the importance of the original variables (buckets) in the variance space. In ideal cases a set of loadings refers to signals of a compound.
Analysis of Bucket Variables Menu bar / Options Data Viewer Loadings Plot Bucket table
Covariance matrix The covariance matrix looks like a TOCSY, cross - peaks indicate correlated fluctuations. This includes multi molecular fluctuations. Rows at cursor position are shown on top of the 2D matrix.
Covariance Analysis row from covariance matrix reference spectrum from spectra base Interesting rows can be saved to disk as 1D NMR spectra and used for spectra base searching as any other 1D spectrum. Often, a small number of compounds from the spectra base match well while others do not.
PCA analysis of 69 newborn urine LC-MS spectra 1: selecting two LC-MS runs differing in the PC1 values from scores plot 2: selecting bucket (spectral region) from loadings plot with high PC1 value Loadings plot (PC1-PC2) Scores plot (PC1-PC2) Generate Sum- Formula no peak peak LC-MS (run 1) LC-MS (run 2)
Intensity Experimental Peak Intensities & Masses m/z Electron Configuration M+ M+* Sum-Formula Generation C/H Ratio, Elemental Limits Isotope Masses, Abundances N-rule; isotope distribution double bond equiv. Fast, exact calculation of isotopic Patterns Molecular Constraints Fast Formula Generator using CHNO Algorithm List of Hits & Mass/Intensity Patterns
Formula Scoring: Isotopic pattern as additional decision criteria for elemental composition List of Hits & Mass/Intensity Patterns Intensity Three independent Scores: Intensity Ratios Intensity weighted mean Masses Intensity weighted Peak Distances Experimental Intensities & Masses m/z { Theoretical Intensities & Masses }
Calculating the elemental composition Simulated mass spectrum of Chlorpyriphos 12C isotope peak 13C isotope peak (11% int.) 3 x Cl isotope peaks
Clinical Proteomics The samples are different The experimental and mathematical techniques are similar But the goal is the same
* * * Workflow Clinical Proteomics Binding Washing Patients Serum Samples Isolation Elution Analysis Detection Normal Normal Disease Clinical Results MALDI-TOF MS W. Pusch et. al., Pharmacogenomics (2003) 4(4), 463-476
Aim: Extraction of the same set of features from each individual spectrum. These features will be used for model generation and later for classification of new spectra. As with metabonomics the identification of the features is of large interest Steps: Quality Checks for spectra Recalibration, Baseline correction, Noise Reduction Peak detection and area calculation Normalization of peak areas Data Preparation
Data preprocessing Peak annotation Statistical characterization Discriminance analysis Most of the tasks are quite similar for both kinds of applications except for the dimensionality of the original data: 1D MALDI 2D LCMS-ESI MS Tasks for Clicinal Proteomics Data Analysis
Data Preprocessing : Recalibration Problem: peaks are not aligned to each other as in this example; For LC-MS it is usually the retention time • Solution: application of a recalibration algorithm • Result:peaks are alignedto each other
Data Preprocessing : Recalibration Prominent peak Mass shift Above mass tolerance shifted Intensity In tol. but not prominent Spec 1 Spec 2 linear mass shift m/z • Selection of prominent peaks (e.g. 30% occurrence) • Use this peak list with average masses as calibrants • Assignment of peaks and calibrants with a mass tolerance • Recalibration of all spectra by solving least square problems for a linear mass shift
Aim: Transformation of spectrum from time-amplitude (mass spectra) domain into time-frequency (Fourier) or time-scale (Wavelet) representation Benefit: - decomposition into distinct frequency/scale bands significant features (peaks, patterns) occur on specific frequencies/scales Steps for wavelet decomposition: low pass filter approximation coefficients high pass filter detail coefficients Data Transformation Wavelet vs. Fourier
Wavelets for Feature Extraction Aim: Determine features from the spectra which are discriminant for class separation Method: Wavelet-Transformation • gives information about the signal • localized in time (m/z) and frequency • lower freq. corresponds to raw structural information of the spectrum • higher freq. corresponds to fine/detailed information • in contrast to FFT we get knowledge were the feature is located in time (m/z) Feature selection: • we get much features (dep. on time resolution) • Brute force + sophisticated feature selection needed
Peak detection Problem: • Common sets of peaks needed for later model stage • Different peaks vary to a different extent over all spectra • Small peaks , nevertheless giving a good separation between classes, might be overlooked only considering single spectra average spectrum single spectrum
Peak detection Solution - ClinProTools: • Determination of peak positions by use of Average-Spectrum • Integration over start and end Masses for detected Peaks Blue areas indicate picked peaks Red area for picked peaks in Model (see later) average spectrum
Average spectra per class Peak at ca. 2022Da – Idx 24 in Model of most imp. 15 Peaks for GA and SVM Avg.-spec class 1 Avg.-spec class 2 Avg.-spec class 3 Avg.-spec class 4
Univariate Statistics: Getting a basic idea about the data Calculation based on: peak intensities / peak areas descriptive / robust statistics Welch`s t-test / Wilcoxen test Statistic peak area sorted according p-value
Algorithms for Discriminate Analysis Some alternatives to classical linear DA: • Feature selection: Genetic Algorithms (GA) + Cluster Analysis • Support Vector Machines (SVM)
Solution = combinations of peaks Initial population: randomly generated solutions Start with multiple initial populations using a migration schema Each solution is assigned a fitness value according to its ability to separate two or more classes (using centroid or KNN-clustering and by determination of between and within class distances) New generations of population are formed using Selection: the fitter a solution, the higher the chance for being selected as a parent Crossover: parents form new solutions by exchanging some of their peaks, new solutions replace parents Mutation: random changes in solutions Result: combinations of peaks, which separate classes best GA: Application to MS data
GA: Genetic Evolution Chromosome 1 Chromosome 2 1700 1800 2000 2200 2300 1000 1200 1700 2100 2500 Start Set 1000 1200 1500 2100 2500 1700 1800 2000 2150 2300 Mutation 2150 2300 1000 1200 1500 2100 2500 1700 1800 2000 50-500 cycles Cross Over 1000 1200 1500 2150 2300 1700 1800 2000 2100 2500 Fitness Test using k-NN Selection Keep advantages Discard disadvantages
Spectrum = point in Rn (e.g. areas of selected peaks) Determination of k nearest neighbors for each spectrum Classification of all points using classes of neighboring points Example: point A is classified as class 2, point B as class 1 Fitness value: percentage of correctly classified points calculation of between/within distances Legend: class 1 class 2 A B KNN: k-nearest neighbor clustering
Spectrum = point in Rn (e.g. areas of selected peaks) Spectrum by spectrum is analyzed (iterative process): if it is the first spectrum or too far away from all existing clusters, a new cluster with just this spectrum is created otherwise it is assigned to the nearest cluster, the centroid is recalculated Fitness value: pureness & #clusters (optimal: k clusters, with all spectra of one class) calculation of between/within distances 3 4 1 2 Centroid clustering
~76% pred.* ~91% pred.* ~66% pred.* GA: Results Prediction capability of GA (plot for best 2 peaks) * Prediction acc. for a model with 25 peaks
SVM: Calculation of direction in Rn, which separates best between two classes (supervised method) PCA (principal component analysis): calculation of direction in Rn, which best explains variability (unsuper-vised method, i.e. without looking at class memberships) PCA SVM PCA = SVM SVM: Support Vector Machine supportvectors
Many decision boundaries can separate these two classes. Which should be chosen? What is SVM – Basic problem Assume we have two classes of data points with two peaks Now I look for that line which – optimal - separates these 2 classes Class 2 Class 1 The green boundaries are valid but bad ones
The decision boundary should be as far away from the data of both classes as possible. We should maximize the margin, m: What is SVM – Basic idea Class 2 m Class 1 This problem can be solved by mathematical optimization theory
SVM: Application to MS data • SVM: quadratic optimization problem, solved by an iterative process using Sequential Minimal Optimization • In simplest case a hyperplane separating classes is calculated • Therefrom contribution of individual peaks is calculated From Spectra in 3 classes : We get: Separating hyperplanes Recognition & Prediction accuracy Peak ranking highlighting potential biomarker-patterns
SVM: Application to MS data - results Note its plotted in 2Dbut in fact it is high dimenensional