Download
1 / 39
390 likes | 468 Views
Living World and Populations Review. Ch’s 4, 5, and 6. Ecology. Ecology from big to small Biosphere Ecosystem- abiotic and biotic Communities- different species living in same area (does not include abiotic factors) Populations- same specie living in an area

E N D
Living World and Populations Review Ch’s4, 5, and 6
Ecology • Ecology from big to small • Biosphere • Ecosystem- abiotic and biotic • Communities- different species living in same area (does not include abiotic factors) • Populations- same specie living in an area • Organism- simplest unit, makes up a population
Population Dispersal • Clumped • Random • Uniform
Ecosystem Characteristics • Physical appearance- relative size, stratification, pop distribution • Species diversity- # of diff speices • Species abundance= # of ind of each species • Niche structure= # of eco niches, how they resemble or differ from eachother, species interactions
Ecological Niches • A particular area within a habitat occupied by an organism that includes the function of that organism w/in an ecological community
Interaction among species • Amensalism- :I = one suffers and one is not effected • Penicillium and bacteria • Commensalism- :I = one benefits and the other is not affected • Remora and shark • Competition- = one benefits one is harmed • Hunting • Mutualism- = both benefit • Bees pollinating flowers • parasitism=- = one is benefited at the expense of another • Predation- = good for one, bad for the other • Cougar and bunny • Saprotrophism- :I = obtain nutrients from dead or decaying materials
Keystone species • Really important to the ecosystem • Presence contributes to the diversity of life • If they are extinct then others will follow • Examples) • grizzly bear: transfer nutrients: capture salmon and take them to dry land • Sea stars: prey on sea urchins, mussels, and shellfish, they are the only natural predator, if they are removed, mussel population would grow to much and damage coral reef • Sea otters: protect kelp forest by eating sea urchins that destroy kelp roots • Prairie dogs: create burrows that are used as safe havens for many other species
Species Diversity • Organisms live in diff environments and are adapted to those biomes • Aquatic- don’t spend energy on temperature regulation • Desert – succulents store water, small surface areas exposed to sunlight • Grassland- drought resistant and grass grows our from the bottom to regrow after being eaten • Forest- large leaves to capture scarce light • Temperate scrub forest- chapparal, small waxy coated leaves • Tundra- plants adapted to low light, small amounts of water, low temps, grow mostly in summer
Edge effect • Local environmental changes along a boundary or edge • Example: clear cutting allows sunlight to reach floor of forest making the ground dryer and warmer
Biomes • Antarctic • Benthos • Coastal zones • Coral reefs • Deserts • Freshwater wetlands • Grasslands • Hydrothermal vents • Intertidal • Ocean • Savannas • Taiga • Temperate deciduous forest • Temperate rain forest • Temperate shrub land aka Chaparral • Temperate woodlands • Tropical rainforests • Tropical seasonal forest • Tundra
Energy Flow • Sun is ultimate energy source • Photosynthesis and cell respiration= know basic functions of it!
Food webs and trophic levels • Primary producers= autotrophs= plants • Make food/ photosynthesis • Primary consumers= heterotrophs= herbivores • Eat plants/ cell resp • Secondary or higher consumers= heterotrophs • Carnivores or omnivores • Remember- arrows always go in the direction of energy flow!
Ecological/Trophic Level Pyramids • 90% of energy lost at each level • Less than 3% of light that reaches earth is used in photosynthesis • Aquatic ecosystem is only one that can have a larger heterotrophic biomass • All others have more biomass on lower levels of pyramids
Biodiversity Diversity increasers Diversity decreasers Environmental stress Extreme environ Supply limitations Disturbance in extreme amounts Introduction of species Geographic isolation • Diverse habitats • Disturbance • Conditions with low variations • Trophic levels with high diversity • Middle stages of succession • Evolution
Natural selection • Directional selection- individuals toward one end will do well • Stabilizing selection- pays to be normal, differences do not help • Disruptive selection- its not good to be normal, differences are selected for
Processes of natural selection • Competition • Increase in phenotypic adaptations • Exponential increase in pop • Variations • Limited resources
Define • Speciation • Convergent evolution • Evolutionary relay • Parallel evolution • Graduated equilibrium • Punctuated equilibrium
Major climatic periods • Figure 4.22 – shows changes in temp in last 200 years • Know iceages and cooling trends from 2,000,000 BCE to present • Page 104-105
Succession • Annual plants perennial plants and grass shrubs pines hardwood trees • Most diversity in mid succession • Know the characteristics of the plant communities early vs late succession
Carbon • Major Carbon sinks: • Plant matter • Terrestrial biosphere • Oceans • Sedimentary deposits • Marine sediments/rocks= 75,000,000 bill tons • Ocean= 40,000 bill tons • Fossil fuels= 4,000 bill tons
Carbon and Atmos. • Released back into atmosphere through: • Cellular reparation • Decay of dead material • Burning fossil fuels • Weathering of rocks • Volcanoes • Release by warm ocean waters
Nitrogen • Nitrogen fixation-(nitrogen) N2 (ammonia) NH3 or (nitrate ions) NO3- • Nitrification- NH3 (oxidized )NO2- (nitrite) and NO3- (nitrate) • Assimilation – when animals consume nitrogen based compounds • Ammonification – nitrogen NH3 • Denitrification – Nitrates N2 (gas)
Too much Nitrogen?? • From planting legumes • Chemical fertilizers • Burning biomass • Cattle and feedlots (wastes) • Industrial proccesses
Phosphorus • Found in rocks • Only one that is not found in the atmosphere during any part of cycle • Released by weathering, acid rain, dissolved into soil and taken up by plants • Key element in fertilizers • Clear cutting causes a decrease in phosphorus in soil • Becomes limiting factor in plant growth
Sulfur • Most if found in rocks and deep ocean deposits • Release from weathering of rocksand gas release from vents • Form of hydrogen sulfide ( H2S) and sulfur dioxide SO2 • Converted to SO3 and then to sulfuric acid H2SO4
Water • Powered by solar energy • Precipitation • Evaporation • Transpiration • Condensation • Groundwater
Population ecology • PVA- population viability analysis • Factors that affect PVA • Good conditions + • Bad conditions – • Few competitors + • Unable to migrate – • No defense mechanism – • Able to adapt +
Carrying capacity (K) • S- shaped curve- logistic, shows a population reaching carrying capacity for the environment • Fluctuations around Carry Capacity= pop growth slows down and begins to stabilize
Reproductive strategies r- strategists K- strategists Mature slow Long life Few offspring Pred and prey High parental care • Mature fast • Short life • Usually prey • Too Many offspring • Not endangered • Low prenatal care • Density dependent factors are limits • Small • Type III surv. Curve • Insects rodents
Survivorship Curves • I= late loss • Low infant mortality • Death rates increase as age increases • II= constant loss • All age categories have equal death rate • III= Early loss • A lot of offspring • Death is prevalent early in life, decrease as age increase
Human Population Dynamics • Population change= (crude birth rate + immigration) – (crude death rate + emigration)
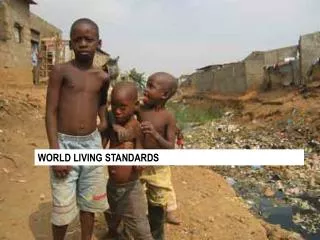
Human distribution patterns • 1800= 65% lived in asia and europe • 1900= 25% lived in just europe (indus rev)
Fertility Rates • RLF= replacement level fertility • Couple replaces themselves ( 2 kids per couple) • MDC= moderately developed countries • LDC- less developed countries • TFR= Total fertility rate • Avg # of kids per womans lifetime • Niger = highest TFR @ 7.46 kids per woman
Rule of 70 • Doubling time= 70/rate of growth • Example– • 2% annual growth rate • Doubling time = 70/ 2= 35 years to double
Demographic transition • Stage 1- pre- industrial • Little pop growth • Birth rates and death rates high • Stage 2- transitional • Start of industrialization • Medical care increases • Birth rate increase, death decreases= increase growth rate • Stage 3- industrial • Birth rate drops- death rate keeps dropping • Growth rate slows • Stage 4- post- industrial • Birth rates = death rates= ZPG (zero pop growth) • Standard of living higher
Impacts of pop growth • Hunger • Poverty • Droughts • Populations surpassed Carry capacity • Political instability- mass migrations • Food exportation- sell to highest bidder