Download
1 / 25
250 likes | 353 Views
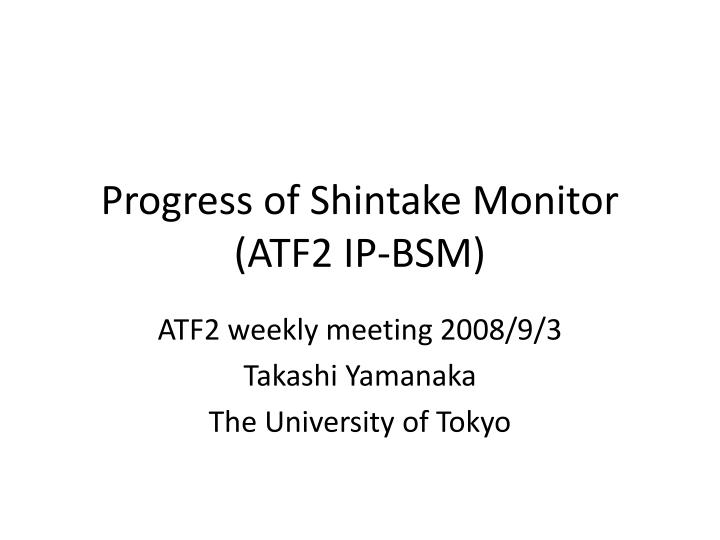
Progress of Shintake Monitor (ATF2 IP-BSM). ATF2 weekly meeting 2008/9/3 Takashi Yamanaka The University of Tokyo. Beam Size Measurement Performance Expectation.

E N D
Progress of Shintake Monitor(ATF2 IP-BSM) ATF2 weekly meeting 2008/9/3 Takashi Yamanaka The University of Tokyo
Beam Size Measurement Performance Expectation • The Shintake optical table was installed at the IP. Performance tests was done and dominant error sources for the beam size measurement were evaluated. • Main measurements are the following. • Laser interference fringe visibility • Laser position stability • Laser phase stability • They can be the main error sources of beam size measurement, so we need to evaluate the amount of errors of them.
Contents • Introduction of the measurements • Results of the measurements • Laser interference fringe visibility • Laser position stability • Laser phase stability • Conclusion • Schedule from now to Beam Operation
Laser Specification • Pulsed Nd:YAG Laser • Wavelength: 532 nm (2nd Harmonics) • Pulse Width: 8 nsec (FWHM) • Repetition Frequency: 10 Hz • Max Pulse Energy: 400 mJ • Pointing Stability: ~10 mrad (Measured)
Visibility Measurement of the Laser Fringe • Scan laser fringe by a photodiode • f1 mm pinhole is attached in front of the photodiode • Laser power is also monitored by another photodiode so the laser profile measurement is not affected by the laser power jitter. delay line for phase stabilization R=100%mirror φ1μm pinhole photodiode R=100%prism R=50%splitter f=250mm convex lens automatic stage Image Inverting Dove prism R=100%mirror
Measurement Setup 50 % Beam Splitter f=250 Convex Lens Pinhole Holder & Automatic Stage
Measurement Results – upper path only – lower path only – both path (interference) • Visibility = (1.7-0.05)/(1.7+0.05) = 0.94 in this measurement • Position jitter and phase jitter cause degradation of fringe visibility, this amount of difference from 100 % visibility is possible. • Irregular pattern of fringe is also caused by position jitter and phase jitter • Coherency of laser itself is thought be very well and the actual fringe visibility is 100 %.
Position Stability • We use the pulsed Nd:YAG laser and it has large angular jitter. This causes the position jitter at the IP. • I measured the position jitter at the IP by using the PSD (Position Sensitive Detector). • We also intend to monitor the laser position at other places and estimate the IP position from these monitored results.
Position Stability Measurement Setup Vertical Optical Table (Front View) Laser Optical Table (Top View) PSD2 PSD1 To the Vertical Table Pulsed Laser IP PSD3 From the Laser Table
Measurement Setup Vertical Table Laser Table
Measurement Results Position Stability at the IP (in 10,000 pulses = 1,000 sec measurement) psd3x (vertical direction) : 3.2 mm (RMS) psd3y(electron beam axis) : 1.9 mm (RMS)
Remarks on the Position Jitter • The position jitter only affects the laser power at the IP • Designed laser beam size at the IP is 20 mm (s= 10 mm), so 3.2 mm and 1.9 mm position jitters correspond to only 5 % and 2 % power reduction respectively.
Phase Stability • Position of peaks and valleys of interference fringe is the laser phase, so the phase stability directly affects the electron beam size measurement • We need to know the phase stability at the IP but it is impossible to monitor at the IP. • We designed the phase monitor to estimate the phase jitter at the IP
Principle of Phase Monitor Calculate the phase of fringe at the peak frequency feedback to Piezo Stage to stabilize the phase FourierTransform Piezo Stage Measure fringe profile Microscope Lens IP 50% Beam Splitter Magnify the interference fringe Linear Image Sensor
Measurement Setup(in 174 degree crossing angle mode) Piezo Stage Microsope Lens IP 50% Beam Splitter Linear Image Sensor
174 degree mode • the smallest beam size measurement mode • fringe pitch at the IP is 266 nm • We set two phase monitor in this mode • Feedback to the Pieszo stage is determined by the first monitor • By using the second monitor we can check the result of the stabilization
Measurement Results(Not Stabilized) ―ch1 ―ch2 • Short time measurement (60 sec: assumed beam size measurement time) • Large drift which can be seen in the long time is ignored in this short span. • There are also small jitter pulse by pulse and seconds order vibration. • Long time measurement • (6000 sec=100 min) • There are large drift and small jitter • It seems to be some correlation between ch1 and ch2 but it is weak pulse repetition frequency is 10 Hz
Correlation of Phase Long time (6000 sec) Short time (60 sec) • In short time correlation can hardly be seen. • ch1 and ch2 correlate some extent but it drift in long time
Phase Stability (Not Stabilized) ch1:1 min Phase RMS = 380 ± 50 mrad ch2: 1 min Phase RMS = 410 ±50 mrad • Results of phase stability in 1 minute measurement • 400 mrad phase correspond to 16.9 nm in 174 degree crossing mode (266 nm fringe pitch) • This amount of phase jitter can be problem in the smallest beam size measurement (37 nm).
Measurement Result(Stabilized) ―ch1 ―ch2 • Long time plot (6000 sec=100 min) • ch1 is stabilized • Drift of ch1 was canceled but ch2 was not • This result indicates that ch1 and ch2 has poor correlation. • Short time plot (60 sec) • Long time drift is also negligible. • Small jitter pulse by pulse is remained in both channels but seconds order vibration is canceled in ch1. • However, this vibration is remained in ch2
Phase Stability (Stabilized) ch1 1 min Phase RMS : 169 ± 9 mrad ch2 1 min Phase RMS : 325 ± 50mrad • Phase jitter of stabilized channel is well reduced • Not stabilized channel gets better only a little. • Phase stability at the IP is assured only ch2 level in this measurement. • 325 mrad correspond to 13.8 nm (266 nm fringe pitch) and it is a little bit large for our goal.
Conclusion • Visibility of the laser fringe is 100 % • Position stability at the IP are 3.2 mm and 1.9 mm for vertical and beam axis respectively, which correspond to 5 % and 2 % laser power jitter. They are small enough! • Phase jitter is estimated to be a littel bit large to measure the small beam size. We may need some improvement on the detectors or devices.
Resolution of Beam Size Measurement • Resolution estimation by using above values • Here, 4000 Compton scattered photon (Signal) and 300 Background photon jitter are asummed • Power jitter 5 % • Phase jitter 325 mrad • Beam Frequency 1.5 Hz and measurement time 1 min -> 45 pulse is assumed
Result of Resolution Calculation ─ 174 degree ─ 30 degree ─ 8 degree ─ 2 degree • Calculation was done by using fitting method. • Large phase jitter causes large systematic error, so reduction of phase jitter is needed. If cannot, correct the systematic error by using the amount of phase jitter. • Power jitter is not so dominant in this condition.