Download
1 / 2
20 likes | 154 Views
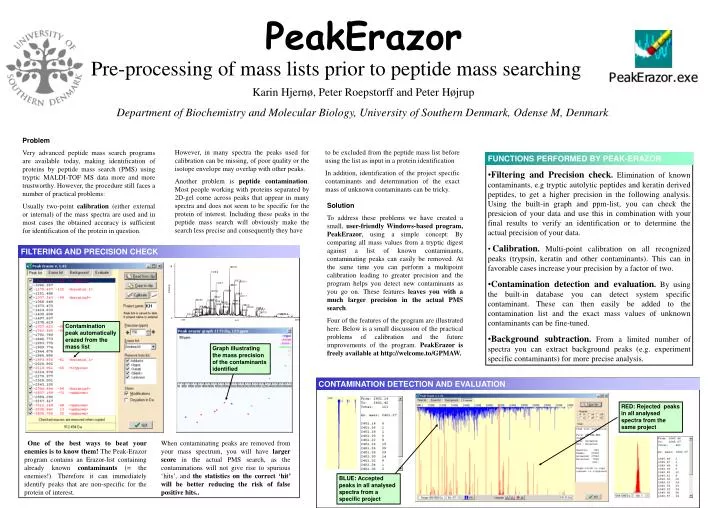
18. 1891.9. 1319.6. 2037.0. 2191.1. 1475.7. 1882.0. Intensity. 1708.9. 1307.6. 2066.0. 2211.1. 1393.7. 842.50. 1277.7. 1179.5. 1994.0. 1435.7. 1607.8. 1948.0. 1702.8. 1458.7. 2284.2. 958.46. 1638.8. 2403.2. 1045.5. 1073.6. 2705.2. 1234.6. 847.47. 2754.4. 759.43.

E N D
18 1891.9 1319.6 2037.0 2191.1 1475.7 1882.0 Intensity 1708.9 1307.6 2066.0 2211.1 1393.7 842.50 1277.7 1179.5 1994.0 1435.7 1607.8 1948.0 1702.8 1458.7 2284.2 958.46 1638.8 2403.2 1045.5 1073.6 2705.2 1234.6 847.47 2754.4 759.43 2249.1 2717.1 823.56 2807.3 <3340.7> <3810.9> 578.47 0 500 4000 m/z FUNCTIONS PERFORMED BY PEAK-ERAZOR • Filtering and Precision check. Elimination of known contaminants, e.g tryptic autolytic peptides and keratin derived peptides, to get a higher precision in the following analysis. Using the built-in graph and ppm-list, you can check the presicion of your data and use this in combination with your final results to verify an identification or to determine the actual precision of your data. • Calibration. Multi-point calibration on all recognized peaks (trypsin, keratin and other contaminants). This can in favorable cases increase your precision by a factor of two. • Contamination detection and evaluation. By using the built-in database you can detect system specific contaminant. These can then easily be added to the contamination list and the exact mass values of unknown contaminants can be fine-tuned. • Background subtraction. From a limited number of spectra you can extract background peaks (e.g. experiment specific contaminants) for more precise analysis. CONTAMINATION DETECTION AND EVALUATION PeakErazor Pre-processing of mass lists prior to peptide mass searching Karin Hjernø, Peter Roepstorff and Peter Højrup Department of Biochemistry and Molecular Biology, University of Southern Denmark, Odense M, Denmark. Problem Very advanced peptide mass search programs are available today, making identification of proteins by peptide mass search (PMS) using tryptic MALDI-TOF MS data more and more trustworthy. However, the procedure still faces a number of practical problems: Usually two-point calibration (either external or internal) of the mass spectra are used and in most cases the obtained accuracy is sufficient for identification of the protein in question. However, in many spectra the peaks used forcalibration can be missing, of poor quality or the isotope envelope may overlap with other peaks. Another problem is peptide contamination. Most people working with proteins separated by 2D-gel come across peaks that appear in many spectra and does not seem to be specific for the protein of interest. Including these peaksin the peptide mass search will obviously make the search less precise and consequently they have to be excluded from the peptide mass list before using the list as input in a protein identification In addition, identification of the project specific contaminants and determination of the exact mass of unknown contaminants can be tricky. Solution To address these problems we have created a small,user-friendly Windows-based program, PeakErazor, using a simple concept:By comparing all mass values from a tryptic digest against a list of known contaminants, contaminating peaks can easily be removed. At the same time you can perform a multipoint calibration leading to greater precision and the program helps you detect new contaminants as you go on.These featuresleaves you with a much larger precision in the actual PMS search. Four of the features of the program are illustrated here. Below is a small discussion of the practical problems of calibration and the future improvements of the program. PeakErazor is freely available at http://welcome.to/GPMAW. FILTERING AND PRECISION CHECK FILTERING AND PRECISION CHECK Contamination peak automatically erazed from the mass list Graph illustrating the mass precision of the contaminants identified RED: Rejected peaks in all analysed spectra from the same project One of the best ways to beat your enemies is to know them! The Peak-Erazor program contains an Erazor-list containing already known contaminants (= the enemies!). Therefore it can immediately identify peaks that are non-specific for the protein of interest. When contaminating peaks are removed from your mass spectrum, you will have larger score in the actual PMS search, as the contaminations will not give rise to spurious ‘hits’, and the statistics on the correct ‘hit’ will be better reducing the risk of false positive hits.. BLUE: Accepted peaks in all analysed spectra from a specific project
The list of contaminants can be evaluated using the information saved by the program itself. Above is an example showing the number of accepted (blue) and rejected (red) masses in a total of 843 spectra. Here otherwise accepted peaks can be recognized as contaminants and hence included in the erazor-list (blue). Another feature of the evaluation part of the program is to make the precision of the unknown contamination masses more and more accurate as the project is going on. This is done by integrating a small area around the mass of interest and then read out the most abundant value (red). CALIBRATION Before multipoint calibration BACKGROUND SUBSTRACTION After multipoint calibration In this example the background is subtracted as ”blank” 15 masses found in at least four out of 6 mass lists within a precision of 100 ppm All calibrations, whether two-point ormultipoint, can be done IN the program using any contaminant peak. The calibration used in the program is a simple linear regression algorithm.. In spectra analysis programs recalibration are possible (e.g. useful before running a second path search) but in some programs any manual peak peaking performed are erased when recalibrating the spectra. This is avoided using Peak-Erazor. These peaks can easily be identified and subtracted in the project using the “Background” part of the Peak-Erazor Program. These masses are added to the erazor-list and given the name “Blank”. When running a large amount of spectra one often stumble upon peaks that are common for many of the spectra and do not seem to be specific for the proteins of interest. Calibration In a linear time-of-flight (TOF) instrument the mass-to-charge (m/z) value is proportional to the square of the ion flight time (t2). However, linear TOF instruments are not sufficient to get a high enough mass accuracy when working with peptides. Therefore, time-delayed ion extraction and reflectrons are built into the instrument to give a very high mass resolution, a low signal-to-noise ratio and high accuracy on the mass determination. Unfortunately, these improvements disturb the simple correlation between m/z and t (1). Instead the correlation is depending on different parameters like initial ion velocity, specific conditions and instruments used. In order to take these effectsintoconsideration, one could do Where to find PeakErazor! The program will be avaliable for free at : http://welcome.to/gpmaw/ Please contact hjernoe@bmb.sdu.dk for further information multipoint calibration with calibration pointsdistributed uniformly over the whole mass range. This can be done using polymers as an external calibration (2). However, a slight difference in the ion flight time is found depending on the location on the target, which means that external calibration is less accurate than internal calibration. Mixing the sample with the polymer is not the way to solve this problem due to ions suppression effects, which will result in polymer suppressing signals from the peptides and vica versa. Instead internal correction of the sample position-dependenterrors can be used (2). Other groups have developed different more or less complicated calibration algorithms (e.g. using polynomial fitting procedure or quadratic correction methods (all resulting in more accurate mass values (3,4). At the moment, a simple linear fit is used for multipointcalibration in PeakErazor. In most cases this enhance the overall precision of the mass values by a factor of 1.5-2x. In the future the goal is to incorporate a higher-order calibration function based on the known peaks already found in the spectrum (trypsin, keratin etc.) or by feeding the program with knowledge from previous protein identifications and in this way build up a useful higher-order function which can be used for a more accurate calibration than the two-point calibration used in most laboratories today. References: 1. Hack, C.A and Benner, W.H., Rapid Commun. Mass Spectrom. 2002;16;1304 2. Gobom, J., Mueller, M., Egelhofer, V., Theiss, D., Lehrach, H. and Nordhoff, E., Anal. Chem. 2002;74;3915 3. Christian, N.P., Arnold, R.J. and Reilly, J.P., Anal. Chem. 2000;72;3327 4. Whittal, R.M., Schriemer, D.C. And Li, L., Anal. Chem. 1997;69;2734