Download
1 / 13
130 likes | 206 Views
Molecular evolution of rDNA in sturgeons: features and mechanisms. Constantine V. Rozhkovan Galina N. Chelomina. Diagram of the rDNA array of eukaryotes.

E N D
Molecular evolution of rDNA in sturgeons: features and mechanisms Constantine V. Rozhkovan Galina N. Chelomina
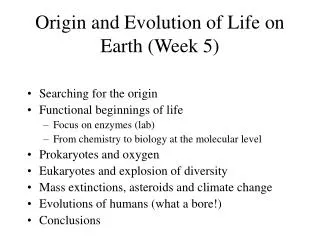
Diagram of the rDNA array of eukaryotes NTS – non-transcribed spacer; ETS – external transcribed spacer; ITS – internal transcribed spacer. The detail of the small subunit (18S) rRNA gene shows PCR primers (and their orientations) used for amplification and sequencing of the gene.Cross-hatched box indicates the cloned and sequenced 486 bp part of the entire gene.
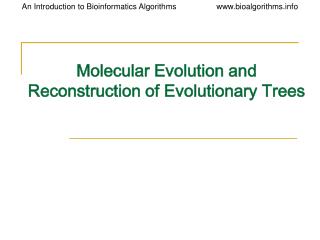
mutation intrachromosomal homogenization interchromosomal gene conversion (rate-limiting step) interchromosomal homogenization Model for concerted evolution of tandemly repeated multi-gene families (Liao, 1999) The coding sequences are depicted as unblackened arrows, and the intergenic spacers are depicted as lines. The flanking sequences of the two arrays are differently labeled (as either blackened or cross-hatched boxes).
18S rDNA diversity in sturgeon species and hybrids n – sample size; S – number of polymorphic (segregating) sites; h – number of haplotypes; Hd – haplotypic diversity; Pi – nucleotide diversity; k – average number of nucleotide differences.
“G E N E S” “P S E U D O G E N E S” Af – Acipenser fulvescens; As – Acipenser schrenckii; Hd – Huso dauricus; SD – A. schrenckii × H. dauricus; SB – A. schrenckii × A. baerii; * - here and further – Genebank data
Genes Pseudogenes A B C Af – A. fulvescens*, As – A. schrenckii, Hd – H. dauricus, A.br – A. brevirostrum*, A.ruth – A. ruthenus*. Number of bars and numerals on connecting lines corresponds to a number of mutation steps, n – number of clones.
Pseudogenes Genes SD – A. schrenckii× H. dauricus, SB – A. schrenckii × A. baerii. Number of bars and numerals on connecting lines corresponds to a number of mutation steps, n – number of clones.
n – sample size; S – number of polymorphic (segregating) sites; h – number of haplotypes; Hd – haplotypic diversity; Pi – nucleotide diversity; k – average number of nucleotide differences. ZnS – Kelly’s neutrality test; L – relative evolution rate; La andLb – the average distances (number of nucleotide substitutions per site) between genes and pseudogenes clusters in comparison with the common ancestor; if Z1.96, than hypothesis of constant evolutionary rate is rejected.
Recombination events R – recombination parameters:Rg – estimate of R per gene, Ras – estimate of R, between adjacent sites; 4 gt – number of pairs of sites with four gametic types;Rm – minimum number of recombination events; S – number of polymorphic (segregating) sites; d – average nucleotide distance between the most distant sites.
Gene conversion Ngc – number of gene conversion tracts identified; Psi – average number of informative nucleotide sites per site; Nis – number of sites with information. First nucleotide of 486 bp fragment corresponds to 960 nucleotide of entire gene sequence
F=48.8%; B=18.2% F=89.3%; B=32% F=89.3%; B=32% F=100%; B=86.1% F=61.1%; B=22.7% 68 35 68 236 68 68 68 260 236 236 236 260 376 236 260 260 260 381 275 275 295 372 392 372 372 333 392 392 396 392 392 435 435 435 435 435 436 436 436 436 436 452 452 452 452 452 Acipenser schrenckii SB Acipenser fulvescens* SD Huso dauricus Linkage disequilibrium Species and hybrids Af – A. fulvescens, As – A. schrenckii, Hd – H. dauricus, SD – A. schrenckii× H. dauricus, SB – A. schrenckii × A. baerii; Light grey rectangle – 0.01<P<0.05; dark grey rectangle – 0.001<P<0.01; black rectangle – P<0.001; F – sites, significant by Fisher’s exact test, B – sites, significant with Bonferroni correction procedure. First nucleotide of 486 bp fragment corresponds to 960 nucleotide of entire gene sequence
F=16.6%; B=0% F=35.5%; B=31.2% F=13.9%; B=0% F=10.7%; B=0% F=63.8%; B=56.5% 35 68 68 68 68 236 235 236 235 260 259 260 259 295 275 274 371 333 372 371 366 391 391 392 392 434 380 435 434 435 435 395 436 436 435 452 451 435 451 452 As Hd Af* SD SB Linkage disequilibrium Pseudogenes Af – A. fulvescens, As – A. schrenckii, Hd – H. dauricus, SD – A. schrenckii× H. dauricus, SB – A. schrenckii × A. baerii; Light grey rectangle – 0.01<P<0.05; dark grey rectangle – 0.001<P<0.01; black rectangle – P<0.001; F – sites, significant by Fisher’s exact test, B – sites, significant with Bonferroni correction procedure. First position of 486 bp fragment corresponds to 960 position of entire gene sequence
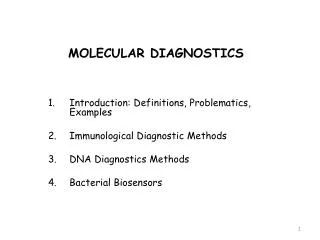
Linkage disequilibrium D D Acipenser schrenckii Huso dauricus 0.4 0.4 0.2 0.2 0.0 0.0 -0.1 -0.1 -0.2 -0.2 400 0 100 200 300 200 0 100 300 400 Nucleotide distance Nucleotide distance D D Acipenser schrenckii× Huso dauricus Acipenser schrenckii× Acipenser baerii 0.4 0.4 0.2 0.2 0.0 0.0 -0.1 -0.1 -0.2 -0.2 100 0 400 100 300 200 300 200 0 400 Nucleotide distance Nucleotide distance