Download
1 / 33
330 likes | 462 Views
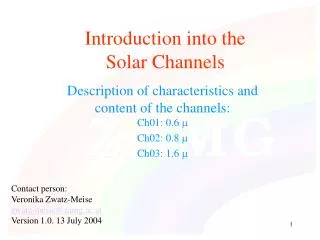
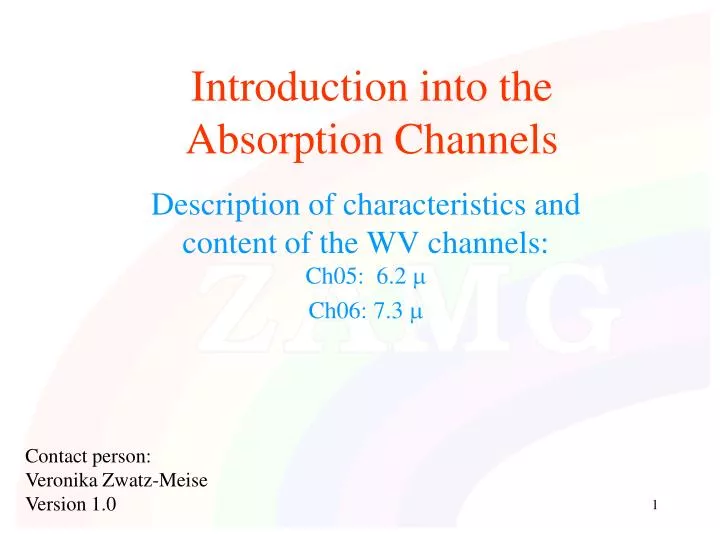
Introduction into the Absorption Channels. Description of characteristics and content of the WV channels: Ch05: 6.2 Ch06: 7.3 . Contact person: Veronika Zwatz-Meise Version 1.0. All MSG channels. Channel 01: VIS 0.6 Channel 02: VIS 0.8 Channel 03: NIR 1.6

E N D
Introduction into the Absorption Channels Description of characteristics and content of the WV channels:Ch05: 6.2 Ch06: 7.3 Contact person: Veronika Zwatz-Meise Version 1.0
All MSG channels • Channel 01: VIS 0.6 • Channel 02: VIS 0.8 • Channel 03: NIR 1.6 • Channel 04: MIR 3.9 • Channel 05 WV 6.2 • Channel 06: WV 7.3 • Channel 07: IR 8.7 • Channel 08: IR 9.7 („Ozon“) • Channel 09: IR 10.8 • Channel 10: IR 12.0 • Channel 11: IR 13.4 „CO2“) • Channel 12: HRV (High Resolution Visible)
Sun radiation Earth radiation Watt/ m2 and micron Ozone Carbon dioxid Water vapour Wavelength (micron)
Comparison of radiation sources sun - earth • For wavelength < 5 m solar radiation is dominant • For wavelength > 5 m terrestrial radiation is dominant • Ch01, 02, 03, 12: only sun radiation • Ch04: both: radiation from sun and earth • Ch 05, 06, 07, 08, 09, 10, 11: only thermal earth radiation Sun radiation Earth radiation W/m2/mm only VIS VIS + IR only IR
Water vapour channels Ch05, Ch06 • WV has an absorption band around 6 m • absorbs radiation from below • emits radiation according to the 2nd Kirchhoff law • Greyshades in the WV are indicative of the WV content in the upper part of the troposphere
Ch05 and Ch06 within WV absorption band around 6m Sun radiation Earth radiation W/m2/mm Ozone CO2 H2O Wavelength (mm)
Ch05 is more in the centre of the absorption band with strong absorption; consequently radiation only from higher levels comes to the satellite; Ch06 is more to the wings of the absorption band with less strong absorption; consequently radiation also from lower layers comes to the satellite Energy spectrum Source:EUMETSAT Ch05 Ch06
Max. signal in Ch05 from approx. 350 hPa Max signal in Ch 06 from approx. 500 hPa But: If there is no WV radiation from far below reaches the satellite Weighting functions Source:EUMETSAT
Max. signal in Ch05 from approx. 320 hPa Max signal in Ch 06 from approx. 450 hPa But: If there is no WV radiation from far below reaches the satellite Weighting functions Source:EUMETSAT
Application areas for the WV channels • Identification of areas with high upper level WV • Identification of jet axes • Cloud intensification areas within jet streaks (left exit region) • Wave developments within jet streaks (right entrance region) • Identification of dry areas in WV • special interest are areas of stratospheric air protruding downward • tropopause folding • PV anomalies • release of secondary cyclogenesis
Some characteristica: WV 6.2 und 7.3 WV • WV content in two different layers • Differentiation between WV content in the lower and higher middle troposphere • Height determination of semi-transparent clouds 6.2 Clouds 7.3
WV images in connection with upper level humidity and the vertical humidity gradient
Ch05:6.2 Black (dry) in upper levels 1 st example
Orange: dry: < 30 % cyan: wet: >60 %
Orange: dry: < 30 % cyan: wet: >60 %
Orange: dry: < 30 % cyan: wet: >60 %
Presentation in form of WV differences • Difference image indicates the amount of high level moisture • Connection to downgliding dry air
Ch05 Distinct black stripe only in upper layers grey area in both levels; darker in the lower layer No big difference between the two channels: cloud edge
Example for dry air in lower levels below frontal surface and jet axis wet dry wet dry