Download
1 / 18
180 likes | 325 Views
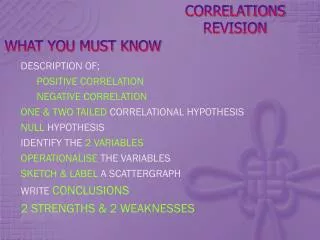
Correlations. NOT causal relationship between variables predictive. Scatterplot. Positive Correlation. Negative Correlation. No correlation. Correlation values . -1 to +1 .56, -.45, -.09, .89, -.93. Appropriate Correlations.

E N D
Correlations • NOT causal • relationship between variables • predictive
Correlation values -1 to +1 .56, -.45, -.09, .89, -.93
Appropriate Correlations 1 - data must be linear not curvilinear (determine by scatterplot)
Appropriate Correlation to use 1 – linear data 2 - type of scale interval (or ratio) = Pearson r ordinal = Spearman rho 3 - number of subjects more than 30 = Pearson fewer than 30 = Spearman
Decision Tree Linear No = no corr yes = corr Scale ordinal = rho interval = r number < 30 = rho > 30 = r
Multiple correlations • Correlations between more than one variable done at the same time.
Multiple regression • Relationship between more variables • Uses specific predictor and criterion variables • Looks at relationships between predictors • Can factor out partial relationships
Multiple regression - example • Grad school grade performance = criterion (or outcome) • Predictor variables = undergrad GPA = GRE scores = Quality of statement of purpose
Multiple regression data PredictorBeta (=r)significance (p) GPA .80 .01 GRE .55 .05 statement.20.20
Multiple regression – example 2 • Predictor variables = Metacognition, Locus of Control, Learning Style • Criterion variable = academic performance (grade)
Multiple regression data PredictorBeta (=r)significance (p) Meta. .75 .01 LofC .65 .05 L.S. .32 .15
Project question • Which correlation formula would you use when correlating the scores from your measure with another variable? • Why?