Download
1 / 27
270 likes | 377 Views
OUTLINE. IntroductionSteps to estimate evapotranspirationResultsConclusion. INTRODUCTION. Overview. Goal: Take calculated ET point values and interpolate over an area to obtain a volume of water lost to ET over a year period and use mass balance to obtain a net depletion from groundwaterCa

E N D
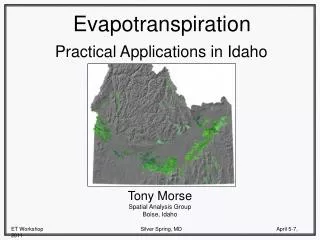
1. EVAPOTRANSPIRATION IN THE FRENCHMAN CREEK SUBBASIN Jean Hilger
Term Project
CIVE 498: GIS Water Resources
November 28, 2006
Introduce
For my term project I chose the topic Evapotranspiration,
and I studied a specific area - Frenchman Creek subbasinIntroduce
For my term project I chose the topic Evapotranspiration,
and I studied a specific area - Frenchman Creek subbasin
2. OUTLINE Introduction
Steps to estimate
evapotranspiration
Results
Conclusion
3. INTRODUCTION
4. Originally thought I would use GIS to calculate ET, come to realize, as Aysha showed us, it takes about 25 powerpoint slides, several years, remote sensing satellites and a PHD to do that.
Palmer Drought Index: (from National Climate Data Center)
4 extremely wet
-3 severe drought
Good comparisonOriginally thought I would use GIS to calculate ET, come to realize, as Aysha showed us, it takes about 25 powerpoint slides, several years, remote sensing satellites and a PHD to do that.
Palmer Drought Index: (from National Climate Data Center)
4 extremely wet
-3 severe drought
Good comparison
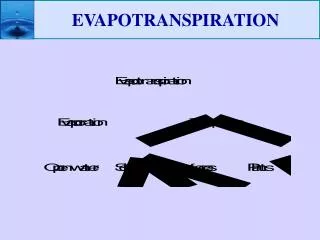
5. Definition
Just in case you missed Ayse�s lecture, I�ll repeat some of the things she told us about ET
Net depletion � if all others are known (P, ET, O) GW easy to quantify.Definition
Just in case you missed Ayse�s lecture, I�ll repeat some of the things she told us about ET
Net depletion � if all others are known (P, ET, O) GW easy to quantify.
6. Location of Frenchman inside the republican
This is from USGS NHD (National Hydrography Dataset)
Republican is a 4 digit huc
8 digit huc (10250002, 1025 for the Republican)
Location of Frenchman inside the republican
This is from USGS NHD (National Hydrography Dataset)
Republican is a 4 digit huc
8 digit huc (10250002, 1025 for the Republican)
7. Predevelopment to 2005, from UNL Statewide GIS datasets, CALMIT/CSD
Part of the reason I selected the Frenchman Creek subbasin� dead center in this red zonePredevelopment to 2005, from UNL Statewide GIS datasets, CALMIT/CSD
Part of the reason I selected the Frenchman Creek subbasin� dead center in this red zone
8. STEPS TO ESTIMATE EVAPOTRANSPIRATION
9. 1. Downloaded ET point data from HPRCC HPRCC stands for High Plains Regional Climate Center
University of Nebraska- Lincoln School of Natural Resources
10. Weather measurement stations all across the high plains
HPRCC calculates ET using collected data with Penman Equation and Nebraska Wind Function
Records hourly data for air temperature and humidity, soil temperature, wind speed and direction, solar radiation, and precipitation
They post data online, with password can access and downloadRecords hourly data for air temperature and humidity, soil temperature, wind speed and direction, solar radiation, and precipitation
They post data online, with password can access and download
11. 2. Selected 10 stations in and around the Frenchman subbasin Stations nearest to Frenchman subbasinStations nearest to Frenchman subbasin
12. Daily ET data at each station
Downloaded for 1993 and 2003
This is what the raw data looks like
From excell file, highlighted is month, day, year, and on the right, ET in inches
List continues through all 12 months, but that would be too long to put on a PowerPoint slideThis is what the raw data looks like
From excell file, highlighted is month, day, year, and on the right, ET in inches
List continues through all 12 months, but that would be too long to put on a PowerPoint slide
13. 3. Summed daily ET over each month to obtain monthly ET An example of the summed ET for same station as last slide, Sterling ColoradoAn example of the summed ET for same station as last slide, Sterling Colorado
14. 4. Created a point feature class of the 10 selected stations Create .dbf table containing latitude and longitude of each station and monthly ET
Display xy data in ArcMap
Export events to Geodatabase feature class Two point feature classes � one for each year
Attributes of each point:
Station Name, Latitude, Longitude, Jan ET, Feb ET, March ET� etc.Two point feature classes � one for each year
Attributes of each point:
Station Name, Latitude, Longitude, Jan ET, Feb ET, March ET� etc.
15. 5. For each month, interpolated point ET data to raster data Geostatistical Analyst > Geostatistical Wizard > Kriging
Spatial Analyst > Interpolate to Raster > Kriging or Spline
Two ways to predict ET values in between stations:
1. Geostatistical Wizard � more detailed, more user input, can explore data
2. Spatial Analyst � I tried to use Kriging for most, but Spline seemed to work better for less points, so used that most of the timeTwo ways to predict ET values in between stations:
1. Geostatistical Wizard � more detailed, more user input, can explore data
2. Spatial Analyst � I tried to use Kriging for most, but Spline seemed to work better for less points, so used that most of the time
16. Example! Love these pictures! This is a raster, displayed w/ contours
These are the ET contours
Can see it prediced for layer contained by the point data, covers the subbasin
Range from 0.9 � 1.9 inches
Example! Love these pictures! This is a raster, displayed w/ contours
These are the ET contours
Can see it prediced for layer contained by the point data, covers the subbasin
Range from 0.9 � 1.9 inches
17. For July
Range 5.8 � 10.24 inches
Did this for 24 monthsFor July
Range 5.8 � 10.24 inches
Did this for 24 months
18. 6. Calculate mean evapotranspiration over the Frenchman subbasin for each month Spatial Analyst > Zonal Statistics
Boundary: 8 digit huc of Frenchman subbasin
Raster: Interpolated ET, by month Then, for each of the 24, used spatial analyst, zonal statistics w/ huc bouandry to calculate the mean ET value in inches over the basin.Then, for each of the 24, used spatial analyst, zonal statistics w/ huc bouandry to calculate the mean ET value in inches over the basin.
19. RESULTS
20. Monthly ET Here are the spatial analyst calculated means for each of the 24 layers
About 60 in. for 1993
About 75 in for 2003Here are the spatial analyst calculated means for each of the 24 layers
About 60 in. for 1993
About 75 in for 2003
21. Same information in bar chart� easier to understandSame information in bar chart� easier to understand
22. Go from inches to a volume � need an area
To find basin area:
Huc shapefile was in GCS_North_American_1983, had to project to NAD_1983_UTM_Zone_14N (check this!) and when take Zonal Statistics with Spatial Analyst one of the attributes it calculates is area in m2.
ET (convert to feet) x area = volume of waterGo from inches to a volume � need an area
To find basin area:
Huc shapefile was in GCS_North_American_1983, had to project to NAD_1983_UTM_Zone_14N (check this!) and when take Zonal Statistics with Spatial Analyst one of the attributes it calculates is area in m2.
ET (convert to feet) x area = volume of water
23. These are the rough estimates I came up with.
Over 5 million for 2003
4 million for 1993
Wondered� where�s all that water coming from?These are the rough estimates I came up with.
Over 5 million for 2003
4 million for 1993
Wondered� where�s all that water coming from?
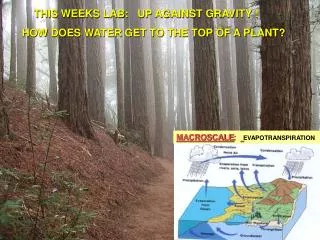
24. Simple model of Water Mass Balance on the Land Surface�
point out ins and out, explain eqn
ET from precipitation and irrigation
irrigation from pumping and surface
Gets complicated make assumptions and simplifications
(ie. lump infiltration in with GW and just consider net interaction with groundwater)
As said before � ET is an important part of the basin systemSimple model of Water Mass Balance on the Land Surface�
point out ins and out, explain eqn
ET from precipitation and irrigation
irrigation from pumping and surface
Gets complicated make assumptions and simplifications
(ie. lump infiltration in with GW and just consider net interaction with groundwater)
As said before � ET is an important part of the basin system
25. Precipitation data - National Climate Data Center
Flow data - Nebraska Department of Natural Resources
- Culbertson gage
- just before the Frenchman Creek dumps into the Republican River
Notice � assumed positive GW, come up with negative - depletion
Conclusive evidence that the groundwater table is sinking?
At least-- it gives us a better understanding of the basin as a system.Precipitation data - National Climate Data Center
Flow data - Nebraska Department of Natural Resources
- Culbertson gage
- just before the Frenchman Creek dumps into the Republican River
Notice � assumed positive GW, come up with negative - depletion
Conclusive evidence that the groundwater table is sinking?
At least-- it gives us a better understanding of the basin as a system.
26. CONCLUSION
27. Point data to raster data
Calculate mean
Inches multiplied by area = volume
Calculate groundwater
Point data to raster data
Calculate mean
Inches multiplied by area = volume
Calculate groundwater
28. These numbers seem a little high� may be due to assumptions and simplifications made, but gives a rough estimate
Not conclusions, closing comments, because I think this study brought out more questions than answers for me
Further investigation may include
� why is 2003 more than 1993?? Even though overall drier yearThese numbers seem a little high� may be due to assumptions and simplifications made, but gives a rough estimate
Not conclusions, closing comments, because I think this study brought out more questions than answers for me
Further investigation may include
� why is 2003 more than 1993?? Even though overall drier year