Download
1 / 36
380 likes | 688 Views
Main Memory Technology Direction. Kevin Kilbuck Senior Segment Marketing Manager Computing and Servers Micron Technology, Inc. Agenda. DRAM Technology Trends Computing Customer Requirements Introduction to DDR3. DRAM Technology Trends. Main Memory Data Rate Trends. NGM Diff. NGM SE.

E N D
Main Memory Technology Direction Kevin Kilbuck Senior Segment Marketing Manager Computing and Servers Micron Technology, Inc.
Agenda • DRAM Technology Trends • Computing Customer Requirements • Introduction to DDR3
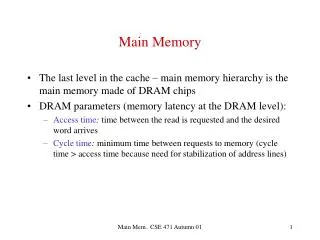
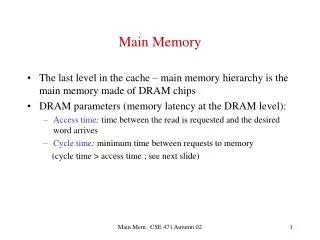
Main Memory Data Rate Trends NGM Diff NGM SE DDR2 DDR SDRAM DDR3 DRAM bandwidth requirements typically double every 3 years
Unit Interval (Bit-time) Trends SDRAM DDR DDR2 DDR3 625ps NGM SE 313ps NGM Diff 156ps 30-40% of UI will be budgeted for RX circuits (jitter+S/H+static)
Die Size Impact Triple Metal
Idd Impact 2.5Gpbs 1.6Gpbs 1.33Gpbs 800Mpbs 400Mpbs X16 X32
Power Dissipation Trends X16 devices at nominal Vdd
Voltage Scaling 7 Historical Enthusiast 6 5 4 3 2 1 0 1990 1995 2000 2005 2010
DRAM Market Price-per-bit Decline (Normalized- Millicent/bit) 1979 1980 Price per Bit (Millicents) 1981 1984 1982 1988 1983 1989 1985 1990 1987 1993 1986 1995 1991 1994 1992 1996 1997 2000 1998 1999 Historical price-per-bit decline has averaged 35.5% (1978 - 2002) 2003 2004F 2001 2006F 2002 2005F 2008F 2007F 100,000,000 1,000,000 10,000 1 100 Cumulative Bit Volume (1012) Historical DRAM Price-Per-Bit Decline ~35%/year
Industry Analyst DRAMDensity forecast Source: IDC, Isuppli, Gartner, Micron Q107
Industry Analyst DRAMInterface forecast DDR3 becomes mainstream in 2009 Source: IDC, iSuppli Q107
Pick two (maybe three if you’re really lucky!) You Can’t Have It All Quality Cost Power DRAM Design & Process Constraints Density Latency Bandwidth
“Give Windows Vista as much memory as you can, and it will thank you by serving you quicker.” Tom’s Hardware, Windows Vista's SuperFetch and ReadyBoost Analyzed, January 31, 2007, http://www.tomshardware.com/2007/01/31/windows-vista-superfetch-and-readyboostanalyzed/index.html Density Matters
Memory utilization is minimized with more system memory installed SuperFetch exhausts DRAM memory before using NAND memory 2GB appears to be optimal DRAM density for Windows Vista Windows Vista RTM Test Results Lower number means your system has more resources available for additional tasks • Multiple programs running • Two Web browsers, Windows Media Player, Adobe Photoshop with 445MB file open, and Trend Virus Protection System Specifications Inspiron 6000 Intel 915GM/PM Windows Vista RC2 Intel Pentium M 1.7Ghz ATI Mobility Radeon X300 80GB Fujitsu ATA
Windows Vista ReadyBoost C&P Lab Results • With 2x CT3264AA667 512MB of DRAM installed: Ready Boost disabled Ready Boost enabled 1:20.04 38.23 sec 1:09.48 33.23 sec 1:15.56 29.81 sec 1:06.06 44.46 sec • With 2x CT6464AA667 1024MB of DRAM installed: Ready Boost disabled Ready Boost enabled 8.39 sec 7.43 sec 8.18 sec 7.29 sec 8.56 sec 6.50 sec 7.81 sec 7.51 sec
Windows Vista ReadyBoost C&P Lab Results • With 2x CT12864AA667 2048MB of DRAM installed: Ready Boost disabled Ready Boost enabled 6.73 sec 5.57 sec 5.93 sec 5.14 sec • With 4x CT12864AA667 4096MB of DRAM installed: Ready Boost disabled Ready Boost enabled 8.01 sec 7.08 sec 5.48 sec 6.29 sec 2GB DRAM achieves the peak performance gain for DRAM density in Windows Vista systems using Ready Boost
DRAM Density Increases CPU Efficiency • As memory density increases, memory utilization decreases • As memory density increases, processor utilization goes up • More memory drastically increases the efficiency of your processor System Specifications Motherboard: Evga NF68 Chipset: nVidia 680i SLI Processor: Intel Pentium 4 2.8GHZ Video: ATI Radeon X1900XTX PCIE 512MB Hard Drive:WD 80GB OS: Windows Vista Ultimate DRAM: Crucial DDR2 6400 Real World Test Processes running to generate utilization: Nero Recode, ADOBE WITH 445 MEG FILE OPEN, 2 WEBSITES OPEN
video Density Matters 1
Dual Die Stacking Technology • Typical monolithic FBGA packages utilize BOC (Board-On-Chip) technology • Typical dual die FBGA packages utilize COB (Chip-On-Board) technology Supports DDR3 data rates 1.2mm thick
Maximum Thickness = 1.35mm Die Die Dual Die Package Construction Top view of a typical RDL layer RDL = Re-distribution layer; center wire bond pads are re-distributed to perimeter of die through a metal layer to facilitate stacking Wire Bonds Substrate
Dual Die Photo • Two die complete with wire bond prior to encapsulation
Power Consumption 4X density increase with little to no power increase 512Mb-based 1GB and 2GB RDIMMs Converting from 512Mb to 1Gb-based reduces power by over 50% Power estimates reflect a maximum DRAM utilization of 67% with a BL=4 and register/PLL power of 1.5W
Estimated WC PowerUsing (1Gb) datasheet values DDR3-1333 is slightly higher than DDR2-800 and about 2.2W more than DDR2-667 DDR3 (DR x4) DDR2 (DR x4) DDR3-1067 is about equal to DDR-667 DDR2-667 DDR2-400 DDR2-533 DDR2-800 Reflects a sustained channel bandwidth of 65% maximum DRAM, 2x READs to WRITEs distributed evenly through all ranks, closed page, single slot populated, PLL/Register package included
DDR3 Energy Efficient Performance For Client • More energy efficient architecture • ~25% better TDP power over DDR2 • Fewer thermal throttling conditions • ~15% platform power reduction in sleep mode • Added platform margin for Energy Star Source: Intel Labs, Q1, 2007 • Increased Performance • ~10% perf gain DDR3-1333 versus DDR2-800 (SPECrateFP) • Expect more gains from overclocking • Increased memory compliment increased CPU performance and provide better system performance Source: Intel Labs, Q1, 2007 Performance tests and ratings are measured using specific computer systems and/or components and reflect the approximate performance of Intel products as measured by those tests. Any difference in system hardware or software design or configuration may affect actual performance. Buyers should consult other sources of information to evaluate the performance of systems or components they are considering purchasing. For more information on performance tests and on the performance of Intel products, visit Intel Performance Benchmark Limitations.
DDR3 Performance Timeline • DDR3 data rate and latency timeline • Fastest speed grade driven by high-end desktop • Mainstream will not pay for speed • Notebook and server segments tend to follow mainstream desktop • 15ns latencies not expected to be required for 1333 and above 2007 2008 2009 Speed Latency tAA (ns) Speed Latency tAA (ns) Speed Latency tAA (ns) CL7 13.125 CL8 12 1600 CL10 12.5 1067 1333 CL8 15 CL9 13.5 CL8 12 1333 CL5 12.5 1067 CL7 13.125 CL9 13.5 800 CL6 15 800 CL5 12.5 1067 CL7 13.125