Download
1 / 8
80 likes | 248 Views
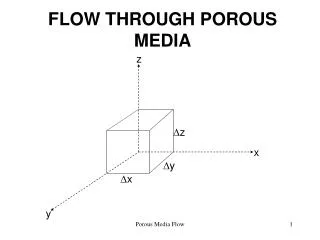
實驗二 Ultrasound Doppler Flow Estimation. 葉秩光. E-mail: d8921035@ee.ntu.edu.tw. 實驗架構. Data Acquisition System. Pulse/receiver. Flow Phantom. trigger. Transducer. Control and Data Processing. A/D. Dampener. Tube. VXI mainframe. Flow Meter. Tubing Pump. Blood Mimicking Fluid. 步驟一.

E N D
實驗二 Ultrasound Doppler Flow Estimation 葉秩光 E-mail: d8921035@ee.ntu.edu.tw
實驗架構 Data Acquisition System Pulse/receiver Flow Phantom trigger Transducer Control and Data Processing A/D Dampener Tube VXI mainframe Flow Meter Tubing Pump Blood Mimicking Fluid
步驟一 Transducer 示波器 管壁 2.54cm 7cm 1mm 3.5MHz 3cm 7cm Beam ( ) Doppler Angle 0.9cm Flow Phantom
步驟二 Pump Damper Flow Meter Shelley Blood Mimicking Fluid fc: 3.5MHz focus length: 7cm aperature size: 2cm PRI: 200usec vessel radius: 4mm Doppler angle Tube
PRI 步驟三 Laminar flow Cross Correlation Program: view_sig(doppler_sig,M,m)
7.9mm 步驟四 流量 (Volume) = 管內面積* 流速 (Velocity) 0.4 (L/min) Flow Meter Cross Correlation Air L/min Water L/min Blood Density:
分析程式 C:\user\doppler\dop_vel.m function [velocity,de]=dop_vel(filename); eval(['load nd',num2str(filename),'.dat']); eval(['data = nd',num2str(filename),';']) data=reshape(data,500,64); fs=20e6; fc=3.5e6; PRI=200e-6; for i=1:63; cor=xcorr(data(200:300,i),data(200:300,i+1)); [de_val1,de_index]=max(cor); de(i)=de_index; end plot(de) xlabel('# of PRI') ylabel('Cross Corrleation') velocity=1/fs*(de(1)-100)*1540e2/2/PRI