Download
1 / 95
950 likes | 1.2k Views
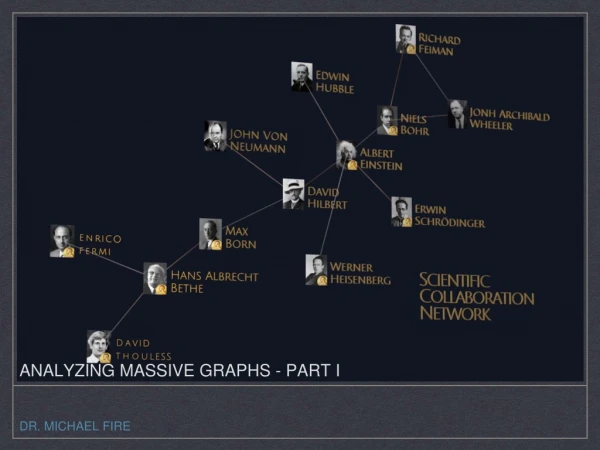
Characterizing and Analyzing Massive Spatio-Temporal Graphs. David A. Bader, David Ediger, Karl Jiang, & Jason Riedy. Outline. Motivation Explosion of Social and Other Networks GraphCT: A Massive Graph Characterization Toolkit

E N D
Characterizing and Analyzing Massive Spatio-Temporal Graphs • David A. Bader, David Ediger, • Karl Jiang, & Jason Riedy
Outline • Motivation • Explosion of Social and Other Networks • GraphCT: A Massive Graph Characterization Toolkit • Provides summaries for graphs with billions of vertices & edges • Tuned for the Cray XMT • A Design for Streaming Graph Analysis • STINGER: Data Structure for Changing Graphs • Initial Experiments with Streaming Clustering Coefficients • Future Directions • Hierarchy of Interesting Temporal Graph Queries
Center for Advanced Supercomputing Software for Multithreaded Architectures (CASS-MT) Objective To design software for the analysis of massive-scale spatio-temporal interaction networks using multithreaded architectures such as the Cray XMT. The Center launched in July 2008 and is led by Pacific-Northwest National Laboratory. Description We are designing and implementing advanced, scalable algorithms for static and dynamic graph analysis, including generalized k-betweenness centrality and dynamic clustering coefficients. Highlights On a 64-processor Cray XMT, k-betweenness centrality scales nearly linearly (58.4x) on a graph with 16M vertices and 134M edges. Initial streaming clustering coefficients handle around 200k updates/sec on a similarly sized graph. Image Courtesy of Cray, Inc. Our research is focusing on temporal analysis, answering questions about changes in global properties (e.g. diameter) as well as local structures (communities, paths). David A. Bader (PI) David Ediger, Karl Jiang, Jason RiedyPacific Northwest National Laboratory
NSF Computing Research Infrastructure:Development of a Research Infrastructure for Multithreaded Computing Community Using Cray Eldorado Platform • The Cray XMT system serves as an ideal platform for the research and development of algorithms, data sets, libraries, languages, tools and simulators for applications that benefit from large numbers of threads, massively data intensive, sparse-graph problems that are difficult to parallelize using conventional message-passing on clusters. • • A shared community resource capable of efficiently running, in experimental and production modes, complex programs with thousands of threads in shared memory • • Assembling software infrastructure for developing and measuring performance of programs running on the hardware • • Building stronger ties between the people themselves, creating ways for researchers at the partner institutions to collaborate and communicate their findings to the broader community Collaborators include: University of Notre Dame, University of Delaware, University of California Santa Barbara, CalTech, University of California Berkeley and Sandia National Laboratories David A. Bader (PI)Jeffrey Vetter (co-PI)NSF CNS-0708307
Massive Social Networks • Facebook has more than 300 million active users • Traditional graph partitioning often fails: • Topology: Interaction graph is low-diameter, and has no good separators • Irregularity: Communities are not uniform in size • Overlap: individuals are members of one or more communities • Sample queries: • Allegiance switching: identify entities that switch communities. • Community structure: identify the genesis and dissipation of communities • Phase change: identify significant change in the network structure 3 orders of magnitude growth in 3 years!
Limitations of Current Tools • Graphs with millions of vertices are well beyond simple comprehension or visualization: we need tools to summarize the graphs. • Existing tools: UCINet, Pajek, SocNetV, tnet • Limitations: • Target workstations, limited in memory • No parallelism, limited in performance. • Scale only to low density graphs with a few million vertices • We need a package that will easily accommodate graphs with several billion vertices and deliver results in a timely manner. • Need parallelism both for computational speed and memory! • The Cray XMT is a natural fit...
What is GraphCT? • GraphCharacterization Toolkit • Efficiently summarizes and analyzes static graph data • Built for large multithreaded, shared memory machines like the Cray XMT • Increases productivity by decreasing programming complexity • Classic metrics & state-of-the-art kernels • Works on many types of graphs • directed or undirected • weighted or unweighted Dynamic spatio-temporal graph
Key Features of GraphCT Low-level primitives to high-level analytic kernels Common graph data structure Develop custom reports by mixing and matching functions Create subgraphs for more in-depth analysis Kernels are tuned to maximize scaling and performance (up to 64 processors) on the Cray XMT Load the Graph Data Find Connected Components Run k-Betweenness Centrality on the largest component
GraphCT Performance • RMAT(24) : 16.7M vertices, 134M edges • RMAT(28) : 268M vertices, 2.1B edges • BC1 : 2800s on 64P • CC : 1200s on 64P
Driving Forces in Social Network Analysis • Note the graph is changing as well as growing. • What are this graph's properties? How do they change? 300 million active Facebook users worldwide in September 2009
Analysis of Graphs with Streaming Updates • STINGER: A Data Structure for Changing Graphs • Light-weight data structure that supports efficient iteration and efficient updates. • Experiments with Streaming Updates to Clustering Coefficients • Working with bulk updates, can handle almost 200k per second
STING Extensible Representation • Enhanced representation developed for dynamic graphs developed in consultation with David A. Bader, Johnathan Berry, Adam Amos-Binks, Daniel Chavarría-Miranda, Charles Hastings, Kamesh Madduri, and Steven C. Poulos. • Design goals: • Be useful for the entire “large graph” community • Portable semantics and high-level optimizations across multiple platforms & frameworks (XMT C, MTGL, etc.) • Permit good performance: No single structure is optimal for all. • Assume globally addressable memory access • Support multiple, parallel readers and a single writer • Operations: • Insert/update & delete both vertices & edges • Aging-off: Remove old edges (by timestamp) • Serialization to support checkpointing, etc.
STING Extensible Representation • Semi-dense edge list blocks with free space • Compactly stores timestamps, types, weights • Maps from application IDs to storage IDs • Deletion by negating IDs, separate compaction
Testbed: Clustering Coefficients • Roughly, the ratio of actual triangles to possible triangles around a vertex. • Defined in terms of triplets. • i-j-v is a closed triplet (triangle). • m-v-n is an open triplet. • Clustering coefficient # closed triplets / # all triplets • Locally, count those around v. • Globally, count across entire graph. • Multiple counting cancels (3/3=1)
Streaming updates to clustering coefficients • Monitoring clustering coefficients could identify anomalies, find forming communities, etc. • Computations stay local. A change to edge <u, v> affects only vertices u, v, and their neighbors. • Need a fast method for updating the triangle counts, degrees when an edge is inserted or deleted. • Dynamic data structure for edges & degrees: STINGER • Rapid triangle count update algorithms: exact and approximate • “Massive Streaming Data Analytics: A Case Study with Clustering Coefficients.” Ediger, David, Karl Jiang, E. Jason Riedy, and David A. Bader. Technical Report, Georgia Tech, Fall 2009. -1 -1 u v -1 -1
Updating clustering coefficients • Using RMAT as a graph and edge stream generator. • Mix of insertions and deletions • Result summary for single actions • Exact: from 8 to 618 actions/second • Approx: from 11 to 640 actions/second • Alternative: Batch changes • Lose some temporal resolution within the batch • Median rates for batches of size B: • STINGER overhead is minimal; most time in spent metric.
Future Directions • User interaction with GraphCT • What characteristics are of interest? • What output reports? • STING, a framework for analyzing Spatio-Temporal Interaction Networks and Graphs • Take current experimental infrastructure and generalize it. • Accept streaming data from outside the XMT. • (Frees up more memory for analyzing the data.) • Incorporate new, novel analysis techniques. • Update metrics, track statistically significant subgraphs (with Dr. Kamesh Madduri, LBNL), ... • And eventually, more complicated user queries. • (Transferring the analysis results back out is an open issue.)
Hierarchy of Interesting Analytics • Extend single-shot graph queries to include time. • Are there s-t paths between time T1 and T2? • What are the important vertices at time T? • Use persistent queries to monitor properties. • Does the path between s and t shorten drastically? • Is some vertex suddenly very central? • Extend persistent queries to fully dynamic properties. • Does a small community stay independent rather than merge with larger groups? • When does a vertex jump between communities? • New types of queries, new challenges...
Recent Publications • Jiang, Karl, David Ediger, and David A. Bader. “Generalizing k-Betweenness Centrality Using Short Paths and a Parallel Multithreaded Implementation.” The 38th International Conference on Parallel Processing (ICPP 2009), Vienna, Austria, September 2009. • Madduri, Kamesh, David Ediger, et al. “A Faster Parallel Algorithm and Efficient Multithreaded Implementations for Evaluating Betweenness Centrality on Massive Datasets.” Third Workshop on Multithreaded Architectures and Applications (MTAAP), Rome, Italy, May 2009. • Bader, David A., et al. “STINGER: Spatio-Temporal Interaction Networks and Graphs (STING) Extensible Representation.” 2009. • Ediger, David, Karl Jiang, E. Jason Riedy, and David A. Bader. “Massive Streaming Data Analytics: A Case Study with Clustering Coefficients,” Technical Report, Georgia Tech, Fall 2009.
Backup • k-Betweenness centrality details • Clustering coefficients details • GraphCT User's & Developer's Guide
Outline: k-Betweenness Centrality, BCk • A new twist on betweenness centrality: • Count short paths in addition to shortest paths • Captures wider connectivity information • Quick introduction and illustration • Applying BCk to the Notre-Dame WWW data set: • How do the scores behave with increasing k? • Which vertices have zero scores? • (Directed and undirected graphs are different.) • Can we approximating by BCk random sampling? • Scalability on the Cray XMT with RMAT graphs.
k-Betweenness Centrality • Measure centrality of a vertex v by the number of paths passing through v between s and t relative to the number of paths connecting s and t. • High betweenness centrality (BC): many shortest paths • High k-betweenness centrality (BCk): many short paths • All paths no longer than the shortest + parameter k counted. • 0-Betweenness centrality is simply betweenness centrality. • 1-BC also counts paths one step longer than the shortest. • BCk captures more connectivity information with k. • Expensive to compute as k grows, but approximated...
v1 v2 Betweenness Centrality • How important are v1 and v2? Use betweenness centrality. • The betweenness centrality of v1, BC(v1): • Consider shortest paths between any two vertices s, t ≠ v1. • Sum over all such s, t: fraction of paths passing through v1
v1 s t v2 BC: Need More Than the Shortest Path? • Consider the view from a particular vertex pair s, t. • Total of five paths, so the st contributions to v1, v2 = 1/5. • But there is more redundancy through v2, more nodes influence / are influenced by v2...
v1 s t v2 k-Betweenness Centrality: Shortest + k • Consider counting paths one longer than the shortest. • Nothing new through v1. Two new paths cross through v2! • k-Betweenness Centrality (BCk): • Consider paths within k of the shortest path. Above is BC1. • 0-Betweenneess centrality is regular BC, BC0(v) = BC(v).
BCk for k > 0: More Path Information • Exact BCk for k = 0, 1, 2 • On directed ND-WWW • Vertices in increasing BCk order (independently) • Large difference going from k = 0 to k > 0 • Few additional paths found in k = 2 • k > 0 captures more path information, somewhat converges
BCk for k > 0: More Path Information • Exact BCk for k = 0, 1, 2 • On directed ND-WWW • Vertices in increasing BCk order (by k = 0) • Large difference going from k = 0 to k > 0 • Few additional paths found in k = 2 • Note how many vertices jump from BC0 = 0 to BCk > 0!
Which Vertices Become Central with k > 0? For k = 0 only For all k One step out of a path Neighbors form a clique 0 in- or out-degree More? (Different than undirected.)
Exact BCk: Too Expensive, So Approximate... • ND-WWW graph: 325K vertices, 1.4M edges (smallish) • 64 processor XMT @ PNNL, 16 proc. runs • Timings (more caveats mentioned later): • Approximate BCk with 256 source vertices v. exact BCk • Not parallel between samples. Limits scalability, but wasn't obvious until the code was optimized (by a factor of 11x). • Exact timings are older code on the 16-proc. XMT. Too slow to run often.
Approximating BCk by Sampling • No approximation theory yet for directed graphs... • Poor normalization, but captures much of the shape. • Percentiles are better quality judge. • Current approximation renders too many zero scores, undersampling. • Missing a handful of vertices in top 5%.
Outline: Clustering coefficients • Quickly define clustering coefficients. • We're not going into interpretation, just computation. • Performance within GraphCT • Static graph, scalable performance. • Performance in a streaming framework • Update clustering coefficients as new data arrives. • Performance for adding edges 1-by-1 and in batches.
Clustering coefficients, undirected graphs • Roughly, the ratio of actual triangles to possible triangles around a vertex. • Defined in terms of triplets. • i-j-v is a closed triplet (triangle). • m-v-n is an open triplet. • Clustering coefficient # closed triplets / # all triplets • Locally, count those around v. • Globally, count across entire graph. • Multiple counting cancels (3/3=1)
Transitive coefficients, directed graphs • Roughly, the ratio of actual triangles to possible triangles around a vertex. But what counts as a triangle? • Possibility: transitive coefficients • i-v-j is a closed triplet, i-v-j has a transitive shortcut, i-j. • m-v-n is an open triplet. • Very sensitive to the direction of edges. • Temporal heuristic: the reverse edges often appear, delayed. Many variations exist in the literature. Computing each is similar; need application requests...
Performance of static clustering coefficients • GraphCT supports basic clustering coefficients and transitivity coefficients • Performance roughly the same for all versions • Nice, inexpensive characterization kernel • Being extended to handle streaming data • Multiple approaches: • Exact: Count locally • Approx: Bloom filters Global clustering coeff: Speed-up of 51x on 64p and RMAT(24)
Streaming updates to clustering coefficients • Monitoring clustering coefficients could identify anomalies, find forming communities, etc. • Luckily, computations stay local. A change to edge <u, v> affects only vertices u, v, and their neighbors. • Need a fast method for updating the triangle counts, degrees when an edge is inserted or deleted. • Dynamic data structure for edges & degrees: STINGER • Rapid triangle count update algorithms: exact and approximate • Technical Report: Ediger, David, Karl Jiang, E. Jason Riedy, and David A. Bader. “Massive Streaming Data Analytics: A Case Study with Clustering Coefficients.” -1 -1 u v -1 -1
Updating clustering coefficients • Update local & global clustering coefficients while edges <u, v> are inserted and deleted. • Exact and approximate approaches: • Exact: Explicitly count triangle changes by doubly-nested loop • O(du * dv), where dx is the degree of x after insertion/deletion • Exact: Sort one edge list, loop over other and search with bisection. • O((du + dv) log (du)) • Approx: Summarize one edge list with a Bloom filter. Loop over other, check using O(1)approximate lookup. May count too many, never too few. • O(du + dv) • Expect issues near high degree vertices (hubs).
Updating clustering coefficients • Using RMAT as a graph and edge generator. • Generate graph with scale S and edge factor F, 2SF edges. • Scale 24: 17 million vertices • Edge factors 8 to 32: 134 to 537 million edges • Generate 1024 actions. • Deletion chance 6.25% = 1/16 • Same RMAT process, will prefer same vertices. • Start with an exact triangle count, run individual updates. • Result summary • Exact: from 8 to 618 actions/second • Approx: from 11 to 640 actions/second
Updating clustering coefficients in a batch • Start with an exact triangle count, run individual batched updates: • Consider B updates at once. • Currently loses some temporal resolution within a batch. Changes to the same edge are collapsed. • Result summary • More analysis in progress...
CASS-MT Task #7 - Georgia TechGraphCT:A Graph Characterization Toolkit • David A. Bader, David Ediger, • Karl Jiang & Jason Riedy October 26, 2009
Outline • Motivation • What is GraphCT? • Package for Massive Social Network Analysis • Can handle graphs with billions of vertices & edges • Key Features • Common data structure • A “buffet” of functions that can be combined • Using GraphCT • Future of GraphCT • Function Reference
Driving Forces in Social Network Analysis • An explosion of data! 300 million active Facebook users worldwide in September 2009
Current Social Network Packages • UCINet, Pajek, SocNetV, tnet • Written in C, Java, Python, Ruby, R • Limitations • Runs on workstation • Single-threaded • Several thousand to several million vertices • Low density graphs • We need a package that will easily accommodate graphs with several billion vertices on large, parallel machines
The Cray XMT • Tolerates latency by massive multithreading • Hardware support for 128 threads on each processor • Globally hashed address space • No data cache • Single cycle context switch • Multiple outstanding memory requests • Support for fine-grained, word-level synchronization • Full/empty bit associated with every memory word • Flexibly supports dynamic load balancing • GraphCT currently tested on a 64 processor XMT: 8192 threads • 512 GB of globally shared memory Image Source: cray.com
What is GraphCT? • GraphCharacterization Toolkit • Efficiently summarizes and analyzes static graph data • Built for large multithreaded, shared memory machines like the Cray XMT • Increases productivity by decreasing programming complexity • Classic metrics & state-of-the-art kernels • Works on all types of graphs • directed or undirected • weighted or unweighted Dynamic spatio-temporal graph
Key Features of GraphCT • Low-level primitives to high-level analytic kernels • Common graph data structure • Develop custom reports by mixing and matching functions • Create subgraphs for more in-depth analysis • Kernels are tuned to maximize scaling and performance (up to 64 processors) on the Cray XMT Load the Graph Data Find Connected Components Run k-Betweenness Centrality on the largest component
Static graph data structure typedef struct { int numEdges; int numVertices; int startVertex[NE]; /* start vertex of edge, sorted, primary key */ int endVertex[NE]; /* end vertex of edge, sorted, secondary key */ int intWeight[NE]; /* integer edge weight */ int edgeStart[NV]; /* per-vertex index into endVertex array */ int marks[NV]; /* common array for marking or coloring of vertices */ } graph;
Usage options • Operations on input graphs can be specified in 3 ways: • Via the command line • Perform a single graph operation • Read in graph, execute kernel, write back result • Via a script [in progress] • Batch multiple operations • Intermediate results need not be written to file (though they can be) • Via a developer’s API • Perform complex series of operations • Manipulate data structures • Implement custom functions