Download
1 / 1
10 likes | 268 Views
ARE YOU STUCK?. Need Help?. Hmm… is Bob stuck?. Academia. Measure students’ progress. Stuck. Could Use Help. Grrr…. Jim. EUREKA!!!. MOTIVATION. Making Progress. Offer help to shy students. Professor. Industry. The greater the distance between developers, the more difficult it

E N D
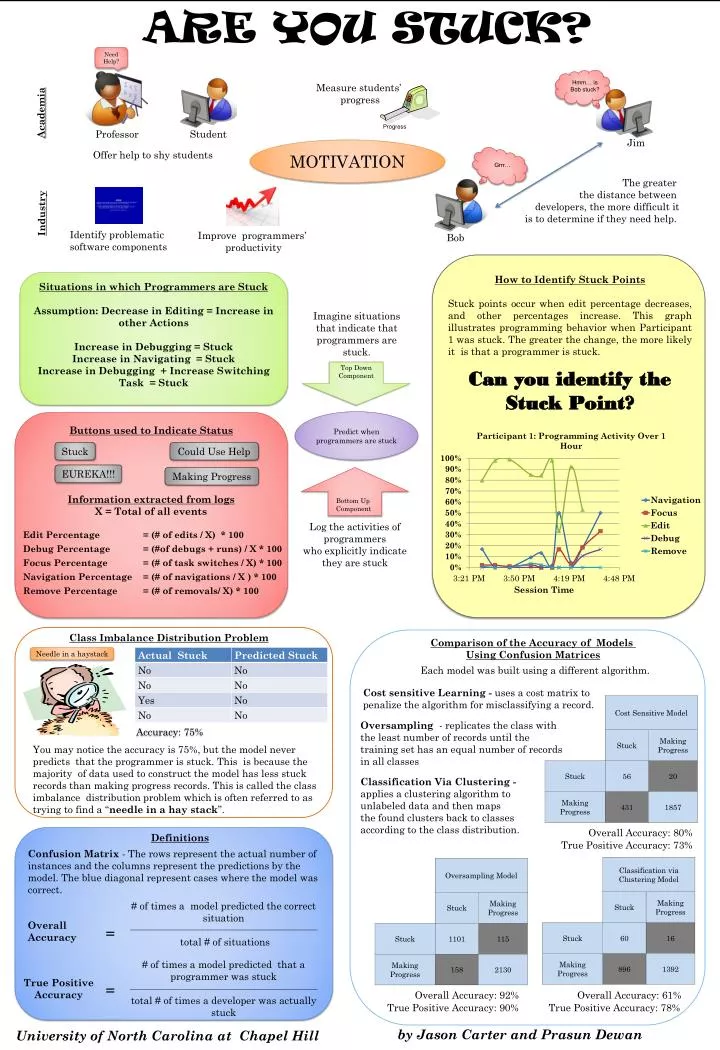
ARE YOU STUCK? Need Help? Hmm… is Bob stuck? Academia Measure students’ progress Stuck Could Use Help Grrr… Jim EUREKA!!! MOTIVATION Making Progress Offer help to shy students Professor Industry The greater the distance between developers, the more difficult it is to determine if they need help. Student Improve programmers’ productivity Identify problematic software components Progress Bob How toIdentify Stuck Points Stuck points occur when edit percentage decreases, and other percentages increase. This graph illustrates programming behavior when Participant 1 was stuck. The greater the change, the more likely it is that a programmer is stuck. Situations in which Programmers are Stuck Assumption: Decrease in Editing = Increase in other Actions Increase in Debugging = Stuck Increase in Navigating = Stuck Increase in Debugging + IncreaseSwitching Task = Stuck Imagine situations that indicate that programmers are stuck. Bottom Up Component Top Down Component Can you identify the Stuck Point? Predict when programmers are stuck Buttons used to Indicate Status Information extracted from logs X = Total of all events Log the activities of programmers who explicitly indicate they are stuck Class Imbalance Distribution Problem Comparison of the Accuracy of Models Using Confusion Matrices Needle in a haystack Each model was built using a different algorithm. Cost sensitive Learning - uses a cost matrix to penalize the algorithm for misclassifying a record. Oversampling - replicates the class with the least number of records until the training set has an equal number of records in all classes Accuracy: 75% You may notice the accuracy is 75%, but the model never predicts that the programmer is stuck. This is because the majority of data used to construct the model has less stuck records than making progress records. This is called the class imbalance distribution problem which is often referred to as trying to find a “needle in a hay stack”. Classification Via Clustering - applies a clustering algorithm to unlabeled data and then maps the found clusters back to classes according to the class distribution. Overall Accuracy: 80% Definitions True Positive Accuracy: 73% Confusion Matrix - The rows represent the actual number of instances and the columns represent the predictions by the model. The blue diagonal represent cases where the model was correct. # of times a model predicted the correct situation total # of situations Overall Accuracy = # of times a model predicted that a programmer was stuck total # of times a developer was actually stuck True Positive Accuracy = Overall Accuracy: 92% Overall Accuracy: 61% True Positive Accuracy: 90% True Positive Accuracy: 78% by Jason Carter and Prasun Dewan University of North Carolina at Chapel Hill