Download
1 / 37
370 likes | 533 Views
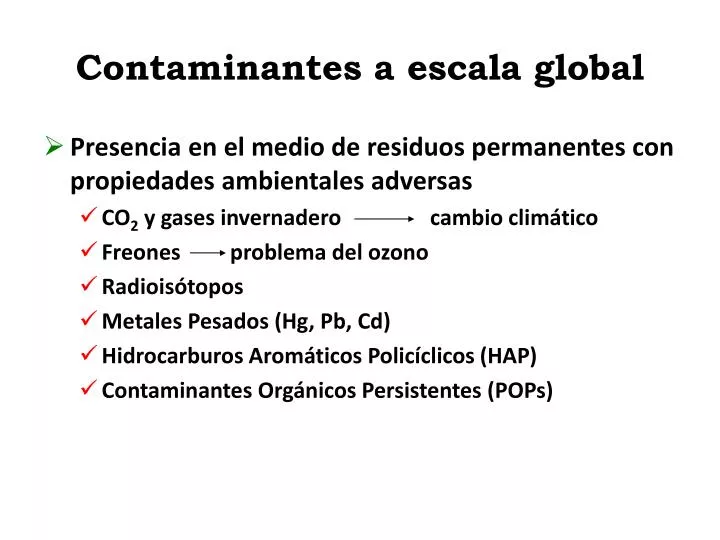
Contaminantes a escala global. Presencia en el medio de residuos permanentes con propiedades ambientales adversas CO 2 y gases invernadero cambio climático Freones problema del ozono Radioisótopos Metales Pesados (Hg, Pb, Cd) Hidrocarburos Aromáticos Policíclicos (HAP)

E N D
Contaminantes a escala global • Presencia en el medio de residuos permanentes con propiedades ambientales adversas • CO2 y gases invernadero cambio climático • Freones problema del ozono • Radioisótopos • Metales Pesados (Hg, Pb, Cd) • Hidrocarburos Aromáticos Policíclicos (HAP) • Contaminantes Orgánicos Persistentes (POPs)
Concentración de CO2 en la atmósfera durante las últimas décadas
0 5 10 15 20 25 30 35 40 45 Evolución de la concentración de CO2 en los últimos 45 kyrs 360 340 320 300 280 CO2 (ppmv) 260 240 220 200 180 Kyr BP
400 350 300 250 200 150 Contenido de CO2 en la atmósfera NIVEL ACTUAL 120 ppm INTERGLACIAL Contenido CO2 en la atmósfera (ppm) 90 ppm GLACIAL
Balance de Energía Radiación infrarroja emitida de nuevo al exterior La Radiación solar se absorbe por la superficie y genera calor Superficie Calor
Gases Invernadero. Origen antropogénico y su contribución al cambio climático* CO2 Combustión de combustibles fósiles Deforestación/ Cambios en el uso de la tierra CFCs Disolventes Refrigerantes Propelentes (aerosoles) Espumas N2O Fertilizantes Conversión tierra para agricultura Quema de biomasa Combustión de combustibles fósiles CH4 Combustión de combustibles fósiles Fugas gas natural Quema de biomasa Rumiantes Cultivo de arroz • Datos de 1980 a 1990. La contribución del Ozono es también • importante, pero no ha sido cuantificada
2300 1900 1500 1100 700 300 Contenido de CH4 en la atmósfera NIVEL ACTUAL 1065 ppb Contenido CH4 en la atmósfera (ppb) INTERGLACIAL 365 ppb GLACIAL
350 320 290 260 230 200 Contenido de N2O en la atmósfera NIVEL ACTUAL 20 ppb INTERGLACIAL Contenido N2O2en la atmósfera (ppb) 100 ppb GLACIAL
Temperatura superficial global del Hemisferio Norte 1.0 1998 0.5 Anomalia de temperatura (oC) 0.0 -0.5 -1.0 1000 1200 1400 1600 1800 2000 Any AD Adaptado de Mann et al., 1999
Swiss temperatures Schär et al Nature 427, 332-336 (2004)
Results from an RCM climate change scenario representing current (CTRL 1961–90) and future (SCEN 2071–2100) conditions. a, b, Statistical distribution of summer temperatures at a grid point in northern Switzerland for CTRL and SCEN, respectively. c, Associated temperature change (SCEN–CTRL, 8C). d, Change in variability expressed as relative change in standard deviation of JJA means ((SCEN–CTRL)/CTRL, %).
Scatter diagrams showing summer mean temperature and precipitation anomalies for northern Switzerland. a, Long-term (1864–2003) station data with respect to 1961–90 means. b, Climate change simulations CTRL (1961–90, blue symbols) and SCEN (2071–90, red symbols) with respect to CTRL means. The green symbols show the observations for JJA 2003. The regression lines in a and b are based on 1864–2002 data and combined CTRL and SCEN data, respectively.
Relación entre Temperatura y concentración de CO2 en la atmósfera