Download
1 / 23
230 likes | 301 Views
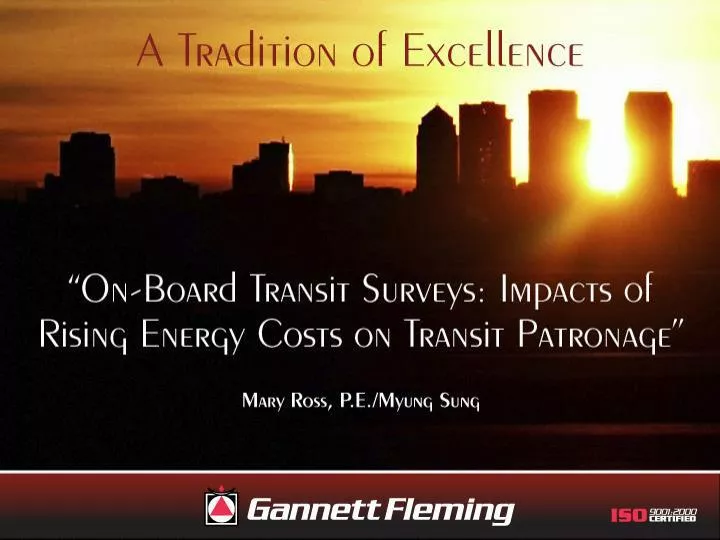
Mary Ross, P.E./Myung Sung. Lower Atlantic Regular Gas Price. HIGH: $4.03- July 2008. LOW: $1.60- Dec 2008. Auto Operating Cost Variable Cost per Mile (In Cents). Average Auto Operating Cost Average Variable Cost per Mile (In Cents). Impact Studies.

E N D
Lower Atlantic Regular Gas Price HIGH: $4.03- July 2008 LOW: $1.60- Dec 2008
Average Auto Operating CostAverage Variable Cost per Mile (In Cents)
Impact Studies Tampa Bay Area Regional Planning Authority (TBARTA) Express Bus Survey in Hillsborough County and Pinellas County, FL South Florida Regional Transportation Authority (SFRTA) Tri-Rail Survey in Palm Beach County, Broward County, and Miami-Dade County, FL
TBARTA Express Bus Survey Methodology Hillsborough Area Regional Transit Authority Express Buses in Hillsborough County and Pinellas County Conducted: June 24/25/26, 2008 Surveys Distributed: 904 Return Rate: 88%
TBARTA Express Bus Survey Instrument Trip Origin? Destination? Off-Stop? Access Mode? Egress Mode? Zip Code? Household Info? Driver’s License? # Cars/Household? Car Availability? Income? Trip Frequency? Public Transit use Frequency?
SFRTA Tri-Rail Survey Methodology FEC Miami-Dade Tri-Rail in Broward County, Palm Beach County, and Miami-Dade County, FL Conducted: Wednesday, October 22, 2008 Surveys Distributed: 8403 Return Rate: 73%
SFRTA Tri-Rail Survey Instrument Zip Code? Gender? Age Race? Education? Household Info? Driver’s License? Income? Number of Cars? Car Availability? Trip Origin? Access Mode? Train Stop? Egress Mode? Destination? Number of Trips Today? Public Transit Use Frequency? Trip Frequency?
Peak of Gas Prices – August 2008 88 Million More Transit Trips than Previous Year Nationwide Total Highest Number of Transit Trips Taken in 50 Years Source: Light Rail Now Project Team, August 2008
Falling Gas Prices – December 2008 Over 2.8 Billion Transit Trips in 3rd Quarter 6.5% Increase from 2007 Largest Increase in 25 Years “The fact that public transit ridership surged while gas prices and highway travel declined, shows a growing demand for more bus and rail services.” Source: Philadelphia Business Journal, December 8, 2008
Current Gas Prices – March 2009 Public Transit at Highest Level in 52 Years 10.7 Billion Trips in 2008 (4% Increase from 2007) “Despite job loses and falling gasoline prices, record numbers of Americans rode subways, buses and commuter rail last year...” Source: The Washington Post, March 9, 2009
Impact of Gas Price Shifts Shifts to choices other than transit: • Fuel-Efficient Vehicles • Fewer or Shorter Trips • Trip Chaining • Telecommuting • 4-Day Work Weeks • Others