Download
1 / 28
280 likes | 352 Views
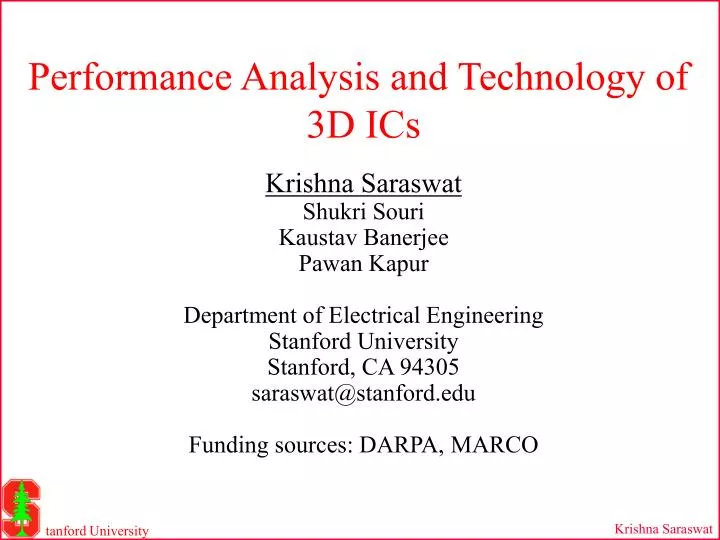
Performance Analysis and Technology of 3D ICs Krishna Saraswat Shukri Souri Kaustav Banerjee Pawan Kapur Department of Electrical Engineering Stanford University Stanford, CA 94305 saraswat@stanford.edu Funding sources: DARPA, MARCO. Outline. Why 3-D ICs?

E N D
Performance Analysis and Technology of 3D ICs Krishna Saraswat Shukri Souri Kaustav Banerjee Pawan Kapur Department of Electrical Engineering Stanford University Stanford, CA 94305 saraswat@stanford.edu Funding sources: DARPA, MARCO
Outline • Why 3-D ICs? • Limits of Cu/low K technology • 3D IC performance simulation • 3-D technologies • Seeding crystallization of amorphous Si • Processed wafer bonding • Thermal simulations
Introduction: Interconnect Delay Is Increasing • Chip size is continually increasing due to increasing complexity • Device performance is improving but interconnect delay is increasing • Chip sizes today are wire-pitch limited: Size is determined by amount of wiring required Mark Bohr, IEDM Proceedings, 1995
Cu Resistivity: Effect of Line Width Scaling • Effect of Cu diffusion Barrier • Barriers have higher resistivity • Barriers can’t be scaled below a minimum thickness • Effect of Electron Scattering • Reduced mobility as dimensions decrease • Effect of Higher Frequencies • Carriers confined to outer skin increasing resistivity Problem is worse than anticipated in the ITRS 1999 roadmap
Cu Resistivity: Barriers Deposition Technology ITRS 1999 Line width (nm) Globel Local 525 250 280 133 95 48 Atomic Layer Deposition (ALD) Ionized PVD Collimated PVD • 5 nm barrier assumed at the thinnest spot • No scattering assumed, I.e., bulk resistivity Interconnect dimensions scaled according to ITRS 1999
Diffuse, Local Diffuse, Global Elastic 373 K Diffuse, Local 273 K Diffuse, Global Elastic Cu Resistivity: Effect of Electron Scattering Diffuse scattering Lower mobility Elastic scattering • No barrier assumed • Diffuse electron scattering increases resistivity • Lowering temperature has a big effect
Fraction of chip area used by repeaters Rent’s exponents As much as 27% of the chip area at 50 nm node is likely to be occupied by repeaters.
Repeaters optical I/O devices Gate n+/p+ n+/p+ VILIC M4 M3 M2 M1 Memory Analog Gate T2 n+/p+ n+/p+ M’2 M’1 Via Gate T1 n+/p+ n+/p+ Logic 3D ICs with Multiple Active Si Layers • Motivation • Performance of ICs is limited due to R, L, C of interconnects • Interconnect length and therefore R, L, C can be minimized by stacking active Si layers • Number of horizontal interconnects can be minimized by using vertical interconnects • Disparate technology integration possible, e.g., memory & logic, optical I/O, etc.
Device Size Limited Memory: SRAM, DRAM Wire Pitch Limited Logic, e.g., µ-Processors Chip Size PMOS NMOS
N gates Rent’s Rule T = k N P T = # of I/O terminals N = # of gates k = avg. I/O’s per gate P = Rent’s exponent
Determination of Wire-length Distribution • Conservation of I/O’s • TA + TB + TC = TA-to-B + TA-to-C + TB-to-C + TABC Block A with NA gates TA-to-B = TA + TB -TAB TB-to-C = TB+ TC -TBC Block B • Values of T within a block or collection of blocks are calculated using Rent’s rule, e.g., • TA = k (NA) P • TABC = k (NA+ NB+ NC) P • Recursive use of Rent’s rule gives wire-length distribution for the whole chip Block C Ref: Davis & Meindl, IEEE TED, March 1998
Inter-Layer Connections For 3-D2-Layers N N/2 N/2 T T2 T1 • Fraction of I/O ports T1and T2 is used for inter-layer connections, Tint • Assume I/O port conservation: T = T1 + T2 - Tint • Use Rent’s Rule: T = kNPto solve for Tint (p assumed constant) k = Avg. I/O’s per gate N = No. of gates p = Rent’s exponent
1 2 5 3 4 1 4 5 3 2 Wire-length Distribution of 3-D IC • Microprocessor Example from NTRS 50 nm Node • Number of Gates 180 million • Minimum Feature Size 50 nm • Number of wiring levels, 9 • Metal Resistivity, Copper 1.673e-6 Ω-cm • Dielectric Constant, Polymer er = 2.5 Single Layer 2 Layers Replace horizontal by vertical interconnect Vertical inter-layer connections reduce metal wiring requirement
Chip Area Estimation • Placement of a wire in a tier is determined by some constraint, e.g., maximum allowed RC delay • Wiring Area = wire pitch x total length • Areq = plocLtot_loc + psemiLtot_semi + pglobLtot_glob • = Aloc + Asemi + Aglob • Ltot calculated from wire-length distribution A 3-tier wiring network Global Semi- global Local
Upper tiers pitches are reduced for constant chip frequency, fc Less wiring needed Almost 50% reduction in chip area 2 Active Layer Results
3-D Wire-Length Distribution Symmetric Interconnects: Comparable inter- and intra-device layer connectivity Asymmetric Interconnects: Negligible inter-device layer connectivity Ref: Rahman & Reif (MIT) N: Number of logic gates, f.o.: fan-out, k and p: Rent’s parameters, Nz: Number of device layers More vertical interconnects required
1.0 0.95 0.85 Normalized Interconnect Delay 0.75 0.65 1 2 3 4 5 No. of Active Layers More than 2 active layers
1 . 0 I n t er c onnec t D el ay 0.1 T ypi c a l ga t e De l ay Interconnect Delay: 0.01 2 D I C w it h r e p e a te r s 3D IC 2X metal layers, 5 Si layers 3 D I C c o n st a n t m e t al la y e r s 2X 3 D I C me ta l l a y e rs 0.001 200 250 50 100 150 T e chno l ogy Ge ne r a t ion (nm ) Delay of Scaled 2D and 3D ICs • Moving repeaters to upper active tiers reduces interconnect delay by 9%. • 3D (2 Si layers) shows significant delay reduction (64%). • Increasing the number of metal levels in 3D improves interconnect delay by another 40%. • Increasing the number of Si layers to 5 further improves interconnect delay. Simulations assumed state-of-the-art chip at a technology node with data from NTRS
Repeaters or optical I/O devices Gate n+/p+ n+/p+ VILIC M4 M3 M2 M1 Memory or Analog Gate T2 n+/p+ n+/p+ M’2 M’1 Via Gate T1 n+/p+ n+/p+ Logic 3D Approaches Wafer Bonding (MIT) Seeding crystallization of -Si (Stanford) Epitaxial Lateral Overgrowth (Purdue)
Statistical Variations in Poly-TFT Properties Mobility Conventional Poly-TFT Grain size 0.3-0.5 µm Effect of Grain Boundaries • As channel length grain size, statistical variation increases • Elimination of grain boundaries should reduce this variation
Ge seeds Seeding SiO2 a -Si Substrate Grain Growth Lateralcrystallization -Si MOSFET Fabrication Gate Gate oxide Grain S o u r c e C h a n n e l D r a i n Substrate Ge Seeded Lateral Crystallization Single Grain 0.1 µm NMOS Concept: • Locally induce nucleation • Grow laterally, inhibiting additional nucleation • Build MOSFET in a single grain
Single Grain Transistors in Ge Induced Crystallized Si ID-VG of 0.1 µm NMOS Mobility SGT
Ni seed SiGe gate SiO2 Crystallized Si -Si substrate Ni Seeded Lateral Crystallization NMOS Tmax = 450ºC • Initially transistor fabricated in -Si • Ni seeding for simultaneous crystallization and dopant activation • Low thermal budget (≤ 450°C) • Devices could be fabricated on top of a metal line
Thermal Behavior in 3D ICs Power Dissipation for 2D • Energy is dissipated during transistor operation • Heat is conducted through the low thermal conductivity dielectric, Silicon substrate and packaging to heat sink • 1-D model assumed to calculate die temperature
Bulk Si M4 n+ n+ T2 Gate M3 M6 M2 M5 M1 M4 Gate M3 T2 p+ p+ M’2 M’2 M’1 M’1 Gate Gate T1 n+ n+ T1 n+ n+ Bulk Si Bulk Si 3D Examples for Thermal Study • Case A: Heat dissipation is confined to one surface • Case B: Heat dissipation possible from 2 surfaces.
Die Temperature Simulation Attainable die temperatures for 2-D and 3-D ICs at the NTRS based 50 nm node using advanced heat-sinking technologies that would reduce the normalized thermal resistance, R
3D ICs: Implications for Circuit Design • Critical Path Layout: By vertical stacking, the distance between logic blocks on the critical path can be reduced to improve circuit performance. • Integration of disparate technologies is easier • Microprocessor Design: on-chip caches on the second active layer will reduce distance from the logic and computational blocks. • RF and Mixed Signal ICs: Substrate isolation between the digital and RF/analog components can be improved by dividing them among separate active layers - ideal for system on a chip design. • Optical I/O can be integrated in the top layer • Repeaters: Chip area can be saved by placing repeaters (~ 10,000 for high performance circuits) on the higher active layers. • Physical Design and Synthesis: Due to a non-planar target graph (upon which the circuit graph is embedded), placement and routing algorithms, and hence synthesis algorithms and architectural choices, need to be suitably modified.
Summary • Cu/low k will not solve the problems of interconnects. • Modeling of interconnect delay shows significant improvement by transitioning from 2-D to 3-D ICs. • Seeding and lateral crystallization of amorphous Si is a promising technique to implement 3-D ICs. • Thermal dissipation in 3-D ICs may require innovative packaging solutions.


![Partha Banerjee:- [Partha Banerjee Mumbai] Partha Banerjee Dubai](https://cdn4.slideserve.com/7975336/mr-partha-banerjee-dt.jpg)