Download
1 / 19
190 likes | 305 Views
Scatter Plots. The scatter plot shows education and income data. a. Describe the person represented by the point with coordinates (10, 30). This person has 10 years of education and earns $30,000 each year. b. How many people have exactly 14 years of education? What are their incomes?.

E N D
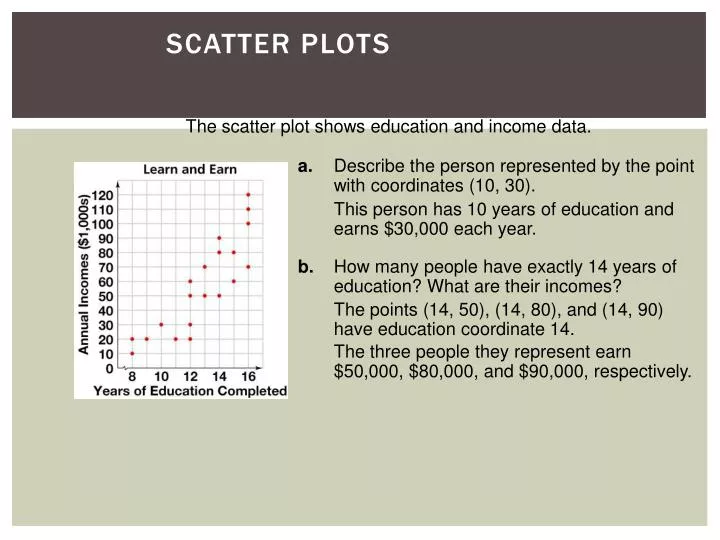
Scatter Plots The scatter plot shows education and income data. a. Describe the person represented by the point with coordinates (10, 30). This person has 10 years of education and earns $30,000 each year. b. How many people have exactly 14 years of education? What are their incomes? The points (14, 50), (14, 80), and (14, 90) have education coordinate 14. The three people they represent earn $50,000, $80,000, and $90,000, respectively.
Elevation Above Sea Level (ft) Mean Annual Precipitation (in.) City 1,050 20 596 18 11 1,072 75 40 1,305 Atlanta, GA Boston, MA Chicago, IL Honolulu, HI Miami, FL Phoenix, AZ Portland, ME San Diego, CA Wichita, KS 51 42 36 22 56 8 44 10 29 Scatter Plots Use the table to make a scatter plot of the elevation and precipitation data.
Scatter Plots Use the scatter plot below. Is there a positive correlation, a negative correlation, or no correlation between temperatures and amounts of precipitation? Explain. The values show no relationship. There is no correlation.
Year Wolf Moose Year Wolf Moose Year Wolf Moose 1982 1983 1984 1985 1986 1987 14 23 24 22 20 16 700 900 811 1,062 1,025 1,380 1988 1989 1990 1991 1992 1993 12 11 15 12 12 13 1,653 1,397 1,216 1,313 1,600 1,880 1994 1995 1996 1997 1998 1999 15 16 22 24 14 25 1,800 2,400 1,200 500 700 750 Problem Solving Strategy: Solve by Graphing Use the data in the table below. Suppose this year there are 16 wolves on the island. Predict how many moose are on the island. Isle Royale Populations
Step 1: Make a scatter plot by graphing the (wolf, moose) ordered pairs. Use the x-axis for wolves and the y-axis for moose. Step 2: Sketch a trend line. The line should be as close as possible to each data point. There should be about as many points above the trend line as below it. Problem Solving Strategy: Solve by Graphing (continued)
Look up to find the point on the trend line that corresponds to 16 wolves. Then look across to the value on the vertical axis, which is about 1,300. Problem Solving Strategy: Solve by Graphing (continued) Step 3: To predict the number of moose when there are 16 wolves, find 16 along the horizontal axis. There are about 1,300 moose on the island.
Step 1: Graph the boundary line. Points on the boundary line do not make y > 2x + 1 true. Use a dashed line. Graphing Linear Inequalities Graph each inequality on a coordinate plane. a.y > 2x + 1
y > 2x + 1 0 2(0) + 1 Substitute. 0 0 + 1 0 > 1 false > > Graphing Linear Inequalities (continued) Step 2: Test a point not on the boundary line. Test (0, 0) in the inequality. Since the inequality is false for (0, 0), shade the region that does not contain (0, 0).
< < – – Step 1: Graph the boundary line. Points on the boundary line make y 3x – 2 true. Use a solid line. Graphing Linear Inequalities (continued) b.y 3x – 2
? ? < < – – < < – – y 3x – 2 0 3(3) – 2 Substitute. 0 9 – 2 0 7 true Graphing Linear Inequalities (continued) Step 2: Test a point not on the boundary line. Test (3, 0) in the inequality. Since the inequality is true for (3, 0), shade the region containing (3, 0).
< – Step 1: Write an inequality. cost of cashews cost of pecans is at most twenty dollars Words plus Let = number of pounds of cashews. y Let = number of pounds of pecans. x Inequality 2y + 4x 20 Graphing Linear Inequalities Cashews cost $2/lb. Pecans cost $4/lb. You plan to spend no more than $20. How many pounds of each can you buy?
< < – – Step 2: Write the equation of the boundary line in slope-intercept form. 2y + 4x 20 y –2x + 10 y = –2x + 10 Step 3: Graph y = –2x + 10 in Quadrant I since weight is not negative. Graphing Linear Inequalities (continued)
? < – < < – – Step 4: Test (1, 1). y –2x + 10 1 –2(1) + 10 1 8 The inequality is true. (1, 1) is a solution. Step 5: Shade the region containing (1, 1). Graphing Linear Inequalities (continued) The graph shows the possible solutions. For example, you could buy 1 pound of pecans and 5 pounds of cashews.
> > – – Step 1: Graph yx + 1 on a coordinate plane. Shade in red. Step 2: Graph y < 2x + 3 on the same coordinate plane. Shade in blue. Graphing Linear Inequalities Solve the system yx + 1 and y < 2x + 3 by graphing.
? < ? > > > – – – Check: See whether the solution (2, 5) makes both of the inequalities true. yx + 1 5 2 + 1 Replace x with 2 and y with 5. 5 3yThe solution checks. y < 2x + 3 5 2(2) + 3 Replace x with 2 and y with 5. 5 < 7yThe solution checks. Graphing Linear Inequalities (continued) The solutions are the coordinates of all the points in the region that is shaded in both colors.
Check: See whether (–3, –10) makes both equations true. y = x – 7 y = 4x + 2 Replace x with – 3 and y with –10. –10–3 – 7 –10 4(–3) + 2 –10 = –10 The solution checks. –10 = –10 Solving Systems of Linear Equations Solve the system y = x – 7 and y = 4x + 2 by graphing. Step 1: Graph each line. Step 2: Find the point of intersection. The lines intersect at one point, (–3, –10). The solution is (–3, –10).
Solving Systems of Linear Equations Solve each system of equations by graphing. a. 27x + 9y = 36; y = 4 – 3x b. 8 = 4x + 2y; 2x + y = 5 The lines are the same line. There are infinitelymany solutions. The lines are parallel. They do not intersect. There is no solution.
Step 1: Write equations. Let x = the greater number. Let y = the lesser number. Equation 1 Sum is 10. x + y = 10 Equation 2 Difference is 2. x – y = 2 Step 2: Graph the equations. The lines intersect at (6, 4). The numbers are 6 and 4. Solving Systems of Linear Equations Find two numbers with a sum of 10 and a difference of 2.
Solving Systems of Linear Equations (continued) Check: Since the sum of 6 and 4 is 10 and the difference of 6 and 4 is 2, the answer is correct.