Download
1 / 30
300 likes | 436 Views
Neural Networks in Electrical Engineering Prof. Howard Silver School of Computer Sciences and Engineering Fairleigh Dickinson University Teaneck, New Jersey. Axon from Another Neuron. Dendrite of Another Neuron. Dendrite. Soma. Synaptic Gap. Axon. Synaptic Gap.

E N D
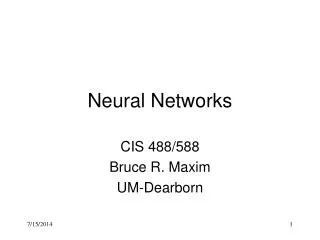
Neural Networks in Electrical Engineering Prof. Howard Silver School of Computer Sciences and Engineering Fairleigh Dickinson University Teaneck, New Jersey
Axon from Another Neuron Dendrite of Another Neuron Dendrite Soma Synaptic Gap Axon Synaptic Gap Axon from Another Neuron Dendrite of Another Neuron Biological Neuron
Example of Supervised Learning Algorithm - Perceptron Steps in applying Perceptron: ! Initialize the weights and bias to 0. ! Set the learning rate alpha (0 < α <= 1) and threshold θ. ! For each input pattern, !__Compute for each output ! yin = b + x1 * w1 + x2 * w2 + x3 * w3 + ...... ! and set !__y = ‑1 for yin < ‑θ !__y = 0 for -θ<= yin <= θ !__y = 1 for yin > θ !__If the jth output yj is not equal to tj, set !____wij(new) = wij(old) + α * xi * tj !____bj(new) = bj(old) + α * tj !__(else no change in wij and bj)
Perceptron Applied to CharacterRecognition Neural net inputs x1 to x25 Binary target output string (t1 to t26)
Classification of Three Sinusoids of Different Frequency >> nnet11i Enter frequency separation in pct. (del) 100 Number of samples per cycle (xtot) 64 Enter number of training epochs (m) 100 Final outputs after training: 100 010 001 Enter signal to noise ratio (SN) - zero to exit 1 Classification of signals embedded in noise 100 010 001 Signals Noisy Signals
>> nnet11i Enter frequency separation in pct. (del) 10 Number of samples per cycle (xtot) 64 Enter number of training epochs (m) 100 Final outputs after training: 100 010 001 Enter signal to noise ratio (SN) - zero to exit 10 Classification of signals embedded in noise 100 010 001 Signals Noisy Signals
>> nnet11i Enter frequency separation in pct. (del) 5 Number of samples per cycle (xtot) 64 Enter number of training epochs (m) 500 Final outputs after training: 100 010 001 Enter signal to noise ratio (SN) - zero to exit 10 Classification of signals embedded in noise 0?0 010 001 Signals Noisy Signals
>> nnet11i Enter frequency separation in pct. (del) 1 Number of samples per cycle (xtot) 1000 Enter number of training epochs (m) 10000 Final outputs after training: 100 010 001 Enter signal to noise ratio (SN) - zero to exit 100 Classification of signals embedded in noise 100 0?0 001 Signals Noisy Signals
Kohonen Learning Steps Initialize the weights (e.g. random values). Set the neighborhood radius (R) and a learning rate (α). Repeat the steps below until convergence or a maximum number of epochs is reached. For each input pattern X = [x1 x2 x3 ......] Compute a "distance" D(j) = (w1j ‑ x1)2 + (w2j ‑ x2)2 + (w3j ‑ x3)2 + ...... for each cluster (i.e. all j), and find jmin, the value of j corresponding to the minimum D(j). If j is "in the neighborhood of" jmin, wij(new) = wij(old) + α [xi ‑ wij(old)] for all i. Decrease α (linearly or geometrically) and reduce R (at a specified rate) if R > 0.
The Traveling Salesman Problem Two input neurons ‑ one each for the x and y coordinate numbers for the cities Distance function: D(j) = (w1j ‑ x1)2 + (w2j ‑ x2)2 Example - 4 cities on the vertices of a square
The coordinates of the cities: Weight matrices from three different runs: W = [ 1 1 ‑1 ‑1 1 ‑1 ‑1 1] W = [ 1 ‑1 ‑1 1 1 1 ‑1 ‑1] W = [‑1 1 1 ‑1 ‑1 ‑1 1 1]
100 “Randomly” Located Cities 0.1 < α < 0.25, 100 epochs, Initial R = 2