Download
1 / 4
40 likes | 212 Views
Adapted from The Practice of Statistics, 4 th edition – For AP* STARNES, YATES, MOORE. Accelerated Math III. Unit 1: How Confident Are You? Sampling Distributions of Sample Proportions. Sample Proportions. Learning Objectives. After this video, you should be able to…

E N D
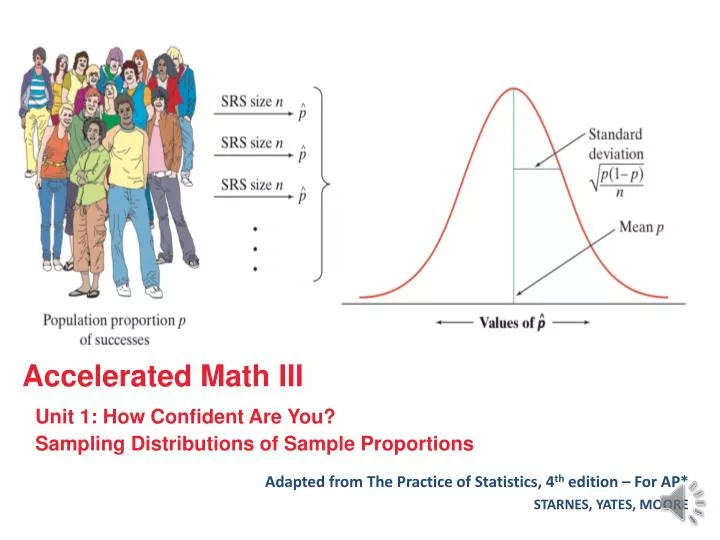
Adapted from The Practice of Statistics, 4th edition – For AP* STARNES, YATES, MOORE Accelerated Math III Unit 1: How Confident Are You? Sampling Distributions of Sample Proportions
Sample Proportions Learning Objectives After this video, you should be able to… • FIND the mean and standard deviation of the sampling distribution of a sample proportion • DETERMINE whether or not it is appropriate to use the Normal approximation to calculate probabilities involving the sample proportion • CALCULATE probabilities involving the sample proportion • EVALUATE a claim about a population proportion using the sampling distribution of the sample proportion
Sampling Distribution of a Sample Proportion As n increases, the sampling distribution becomes approximately Normal. Before you perform Normal calculations, check that the Normal condition is satisfied: np ≥ 10 and n(1 – p) ≥ 10.
Normal Calculations Involving Sample Proportions A polling organization asks an SRS of 1500 first-year college students how far away their home is. Suppose that 35% of all first-year students actually attend college within 50 miles of home. What is the probability that the random sample of 1500 students will give a result within 2 percentage points of this true value? STATE: We want to find the probability that the sample proportion falls between 0.33 and 0.37 (within 2 percentage points, or 0.02, of 0.35). PLAN: We have an SRS of size n = 1500 drawn from a population in which the proportion p = 0.35 attend college within 50 miles of home. *Note: You can also use normalcdf on your calculator to find this probability. • Is our formula for standard deviation valid? • The population must be at least 10(1500) or 15,000. Are there more than this number of first-year college students? • Can we use a Normal distribution to approximate the sampling distribution of ? • np = 1500(0.35) = 525 and n(1 – p) = 1500(0.65) = 975. Are there more than 10 expected successes and 10 expected failures? DO: We’ll standardize and then use Table A to find the desired probability. CONCLUDE: About 90% of all SRSs of size 1500 will give a result within 2 percentage points of the truth about the population.