Download
1 / 24
250 likes | 370 Views
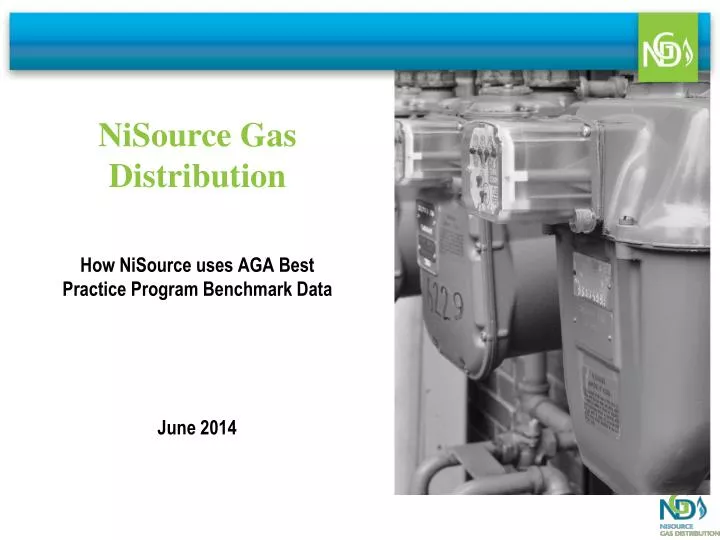
NiSource Gas Distribution. June 2014. How NiSource uses AGA Best Practice Program Benchmark Data. NiSource.

E N D
NiSource Gas Distribution June 2014 How NiSource uses AGA Best Practice Program Benchmark Data
NiSource From the Gulf Coast through the Midwest to the Northeast, our portfolio of companies serves some of the nation’s highest-value energy markets, with services ranging from natural gas transmission, storage and local distribution, to electricity generation, transmission and distribution. Gas Distribution • One of the Nation’s Largest Natural Gas Distribution Companies Serving More Than 3.3 Million Customers • Established Best-in-Class Platform for Sustainable Earnings Growth Through: • Comprehensive Long-Term Infrastructure-Investment Programs • Responsive Customer Programs • Creative Regulatory Approaches Gas Transmission & Storage • 15,000 Mile Network of Interstate Natural Gas Pipelines • One of the Nation’s Largest Market-Area Storage Systems • Unparalleled Strategic Footprint in the Marcellus and Utica Shale Production Region • Deep Inventory of Attractive Investment Opportunities • Long-Term Pipeline System Modernization Program Electric Generation & Distribution • More than 450,000 Industrial, Commercial and Residential Electric Customers in a Stable Marketplace • Environmentally Compliant Fleet of Electric Generation Facilities • Total Generating Capability of 3,300 Megawatts • Long-Term Infrastructure Investment Program
NiSource Gas Distribution (NGD) • NIPSCO Gas • Largest LDC in Indiana • ~800,000 Customers • ~17,000 Miles of Pipe • Fair Value Rate Base ~$800M • Columbia Gas of Massachusetts • Largest Gas-Only LDC in Massachusetts • 300,000 Customers • ~4,800 Miles of Pipe • Rate Base ~$465M • Columbia Gas of Pennsylvania • Third Largest LDC in Pennsylvania • 400,000+ Customers • ~7,400 Miles of Pipe • Rate Base ~$784M • Columbia Gas of Ohio • Largest LDC in Ohio • 1.4 Million Customers • ~20,000 Miles of Pipe • Rate Base ~$1.3B • Columbia Gas of Kentucky • Second Largest Gas-Only LDC in Kentucky • 140,000 Customers • ~2,600 Miles of Pipe • Rate Base ~$173M • Columbia Gas of Maryland • Complementary to PA Operations • 33,000 Customers • ~750 Miles of Pipe • Rate Base ~$54M • Columbia Gas of Virginia • Third Largest LDC in Virginia • ~250,000 Customers • ~5,000 Miles of Pipe • Rate Base ~$417M 3
Benchmarking at NiSource • Our program has been in place for many years and includes DOT, Financial, and EIA data. All are public information that can be obtained freely from various sources • It’s thorough with over 100 companies, highly standardized, and consistent year to year • Over 200 different measures and views • Outputs include a nearly 200 page spiral bound book and tri-fold pamphlet provided to leaders across the company
Benchmarking at NiSource • Always looking for useful new measures to track • The AGA Best Practice Program offers many opportunities to examine new and emerging statistical measures that matter across the industry
Best Practice Benchmarking Slide Decks • After last years meeting these were shared with our leaders
Data review with leaders • Our leaders selected a few slides of particular interest to them, Damages per 1,000 locates was one for example
New measures • We were tracking these internally but this industry wide view was relatively new • We had to make our companies easier to identify • Since it’s a worksheet that wasn’t too hard
Can we add it to our own annual benchmark study? • It turns out this data was added to DOT filing requirements in 2010, so yes we can • A few tweaks of our database and queries…
So why does it matter? • Because now we know where the top quartile and decile are in the industry • And it is clear where our companies are in relation to those positions • Now our leaders have some new information they can act on that they may not have had before
The 2013 program brought several new measures to our attention • Damages per 1,000 locates • Damages per 1,000 system miles - another way to look at damages • Leaks repaired per leaks repaired and on-hand at year end – it’s a mouthful to say but a very interesting statistic • So now we can go back to those damages…
Now we can look at a single state for relative comparisons and over 3 years of time – remember this is public information
But this chart got us talking about replacement rates, which led to a new chart
With our Capital Infrastructure Replacement Program, now we can create some projections
Conclusion • The AGA Programs we participate in allow us to monitor changing industry concerns and identify emerging trends • We can integrate these into our benchmarking program • We can adapt the information as we see fit once we become aware of it • Also we can retire some charts and subjects as they become less relevant