Download
1 / 43
430 likes | 535 Views
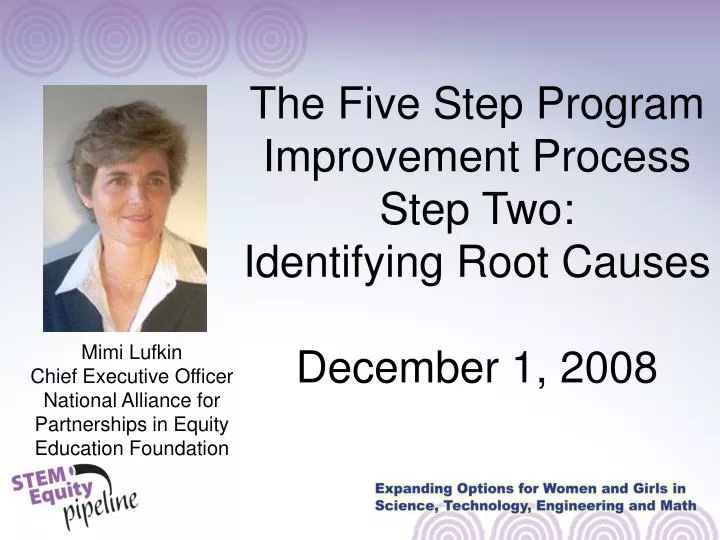
The Five Step Program Improvement Process Step Two: Identifying Root Causes December 1, 2008. Mimi Lufkin Chief Executive Officer National Alliance for Partnerships in Equity Education Foundation. STEM Equity Pipeline Goals. Build the capacity of the formal education community

E N D
The Five Step Program Improvement Process Step Two: Identifying Root Causes December 1, 2008 Mimi Lufkin Chief Executive Officer National Alliance for Partnerships in Equity Education Foundation
STEM Equity Pipeline Goals Build the capacity of the formal education community Institutionalize the implemented strategies by connecting the outcomes to existing accountability systems Broaden the commitment to gender equity in STEM education
Poll Who is participating in today’s webinar? • School/College Administrator • Teacher/Faculty Member • Counselor/Student Services Staff • State Agency Staff • STEM Organization Staff • Other
STEP TWO Identify Root Causes
Why Search for Root Causes? • Keep from fixating on the “silver bullet” strategy • Identify the conditions or factors that cause or permit a performance gap to occur • Two types of causes: • Direct cause (i.e. instructional practice) • Indirect cause (i.e. teacher training)
Review Research Summary Root Causes Tables • Chapter 6 Tables 16, 17, 19, and 20 from, “Improving Performance on Perkins III Core Indicators: Summary of Research on Causes and Improvement Strategies” • Authors: Robert Sheets, Mimi Lufkin, and David Stevens for the National Centers for Career & Technical Education • Available at www.stemequitypipeline.org
Review Research Summary Bias Literacy: A review of concepts in research on discrimination By Ruta Sevo, Ph.D. and Daryl E. Chubin, Ph.D. Available at www.stemequitypipeline.org
Root Causes • Social Attitudes • Bias and Discrimination • Gender schema • Assumptions about gender from birth on • Accumulative Advantage • Members of a disadvantaged group have to accumulate more that 1% advantage to be considered the same as the advantaged group • Implicit bias • Unconscious associations
Root Causes • Media Representation • About-face.org
Root Causes • Early Exposure • Most students pursuing a nontraditional career have had a friend or family member influence them • Spark an interest that would otherwise not be evident • The earlier the better
Root Causes • Nontraditional Role Models • Strongest evidence in the research • Family members are significant • Teachers • Mentors
Root Causes • Self-efficacy • Attribution Theory • Girls more likely to attribute success to external factors and failure to internal factors • Stereotype Threat • Stereotype that girls are not as capable as boys in math affects their performance • Locus of Control • When girls feel they are in control of their lives and their futures they are more likely to select nontraditional options
Root Causes • Family Demographics • Girls with lower socio-economic status parents have higher sex-stereotyping scores • Boys with higher socio-economic status parents have higher sex-stereotyping scores • Family structure or level of education has no effect
Poll • Who is the number one influencer of students career choice? • School guidance counselor • Teacher • Peers/Friends • Parent • Relative • Adult/Family Friend
Root Causes • Spouse/Significant Other/Parental Support • Parents are the #1 influence of student college major and career choice • Negative messages from people with emotional influence difficult to overcome.
Root Causes • School Climate • Nontraditional faculty and staff • Acceptable behavior in hallways, cafeteria, school events, busses, etc. • Administration and staff support and encouragement • Extracurricular activities
Root Causes • Career Guidance Materials and Practices • More than just brochures and posters • Subtle messages • Be careful about how you use interest inventories • Creating opportunities to create student interest
Root Causes • Access to and Participation in STEM • Shrinking gender gap in performance on national assessments in math and science between boys and girls • Still significant gaps when looking at gender AND race/ethnicity or socio-economic status • Girls not translating their academic success in STEM to careers in STEM
Root Causes • Classroom Climate • Fair treatment • Sexual harassment not tolerated or ignored • Supportive learning environment • Subtle messages • Classroom location on campus • Physical environment
Root Causes • Curriculum Materials • Invisibility • Stereotyping • Imbalance/Selectivity • Unreality • Fragmentation/Isolation • Linguistic Bias • Cosmetic Bias • Relevance
Root Causes • Instructional Strategies • Questioning level and wait time • Student/teacher interaction and feedback • Classroom management • Cooperative learning design • Expectations and assessment
Root Causes • Student Attitudes/Peer Influence • Values and beliefs • Acceptance of differences • Bias and stereotypes • Peer support • Peer harassment
Root Causes • Student Isolation Based on Gender • Cohort of underrepresented students in a program are more likely to complete than a single individual • Individuals more likely to • Have trouble integrating effectively in to social structure • Suffer decreased performance • Drop out
Root Causes • Support Services • Tutoring • Child care • Transportation • Financial Aid • Books, Equipment, Tools, Clothing • Tuition • Modification of Curriculum, Equipment • Student/Teacher Aides • More
Root Causes • Occupational Segregation and Choice • Men’s work vs. Women’s work • Traditional vs. nontraditional careers • “sticky floor” vs. “glass ceiling” • Low wages of traditionally female occupations • Pay equity issues
Root Causes • Wage Potential • Traditionally female occupations pay significantly less that traditionally male occupations • When men and women are employed in the same occupation, women on average earn less than men. • Nontraditional occupations for women are typically high wage occupations
How to Identify Root Causes • Search for most direct & highest impact causes • Employ a systematic evidence-based process • Draw on current research and evaluation • Formulate and test theories or hypotheses • Use multiple methods and data sources • Note, you’re likely to find multiple causes
Phase 1: Identify Potential Causes • Review Research Literature • Review Program/Institutional Evaluations and Effectiveness Reviews • Conduct Focus Groups • Peer Benchmarking • Interviews & Surveys • Brainstorm
Resources available at www.stemequitypipeline.org • Survey Instruments • How to Conduct Interviews • How to Conduct Focus Groups
Other Resources The New Look Self-Study Illinois Center for Specialized Professional Support
Phase 2: Analyze and Evaluate Potential Causes Group Causes Into Two Categories: • Group 1: Causes Within Your Control • School scheduling • Classroom climate • Faculty awareness and capacity • Group 2: Causes Outside Your Control • Media representation • Family demographics
Phase 3: Test and Evaluate Potential Causes Within Your Control Select root causes that: • Have the strongest theory and evidence to support them • Focus on direct causes of performance gaps • Address the most critical needs • Provide the best opportunity to have high impact on performance • Are supported by stakeholders who will help develop and implement solutions (See page 17 of the OVAE Guidebook)
Which root cause do you think is the most common barrier for students considering a nontraditional career? • Career guidance practices • Instructional strategies • Role models • Early exposure • Self-efficacy • School climate • Parental/Family support • Peer influence
Next Webinars • Wednesday, December 17, 2008 2pm ET • Stereotype Threat • Impact on girls performance in math • How teachers can alleviate the effect • Tuesday, January 13, 2009 2pm ET • Step Three: Identifying Effective Strategies • Effective strategies to eliminate root causes for the low participation and completion of women and girls in STEM related career and technical education programs
Questions? National Alliance for Partnerships in Equity Mimi Lufkin Executive Director P.O. Box 369 Cochranville, PA 19330 610-593-8038 phone 610-593-7283 fax mimilufkin@napequity.org