Download
1 / 24
240 likes | 258 Views
Preliminary Results From SCEC Earthquake Simulator Comparison Project. Terry Tullis. Michael Barall. Jim Dieterich Keith Richards-Dinger. Nadia Lapusta Yoshi Kaneko Hiro Noda. John Rundle Don Turcotte Louise Kellogg Burak Yikilmaz Eric Heien. Olaf Zielke Ramon Arrowsmith.

E N D
Preliminary Results From SCEC Earthquake Simulator Comparison Project Terry Tullis Michael Barall Jim Dieterich Keith Richards-Dinger Nadia Lapusta Yoshi Kaneko Hiro Noda John Rundle Don Turcotte Louise Kellogg Burak Yikilmaz Eric Heien Olaf Zielke Ramon Arrowsmith Fred Pollitz Ned Field Steve Ward
Purpose and Nature of Project • To understand hazard better, we desire a statistical description of earthquakes for thousands of years • Instrumental, historic, and paleoseismic records are too short and/or too incomplete • Earthquake simulators can generate long histories • However, it is still unclear how realistic these are • Compare results of earthquake simulators with more accurate codes for simple problems • Compare the results for 5 earthquake simulators that can incorporate many faults for more realistic problems of interest
Differences from Dynamic Rupture Comparisons • For the main problems of interest, no underlying well-defined continuum problem to whose solution all earthquake simulators should converge • Incorporate a priori data (e.g. geologic slip rates) • Calibrate some input parameters by comparison against proper dynamic rupture models • Match known characteristics of actual seismicity • Investigate variability of statistics of interest between and within the different earthquake simulators
Common Inputs / Different Approaches • We have developed a common set of input and output formats • Thus all the simulators read the same input data • The output can be processed identically and the results compared directly • Have some tools for processing output; are developing more • Relatively well-known input is fault geometry and slip rates • We assume variations in fault stress drops (“strength”), but constraints on this are not good • Simulators differ in many ways • Representation of fault friction is one big difference • Another is whether/how dynamic triggering is approximated
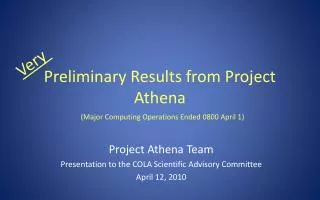
Northern CA paleoseismic sites norcal1 fault model UCERF 2 Preferred recurrence intervals in yrs: UCERF 2 Preferred recurrence intervals in yrs Calaveras fault, North 484 Hayward fault, North 401 Hayward fault, South 150 N. San Andreas, Vendanta 248 SAF, Arano Flat 106 N. San Andreas, Fort Ross 288 San Gregorio, North 0 (San Francisco 0) (Berkeley Campus 0)
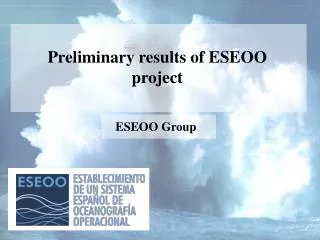
Space – Time Plot ALLCAL There is a wide range of event sizes, even on one fault section norcal1
Space – Time Plot VIRTCAL VIRTCAL has fewer, larger, more regular events. This is due to assuming significant dynamic stress triggering. norcal1
Frequency Magnitude,Cumulative Our Entire N CA Fault System All California observed seismicity, excluding Cascadia (UCERF2) ALLCAL VIRTCAL RSQSim b = 1 Pollitz Zielke norcal1
Moment - Area Scaling ALLCAL VIRTCAL Blue line is Wells and Coppersmith relationship RSQSim norcal1
Moment - Length Scaling ALLCAL VIRTCAL RSQSim norcal1
Moment and Event Rates ALLCAL VIRTCAL M5 M6 M5 M6 M7 M7 Note that 500 yr intervals can be found that differ significantly from other 500 yr intervals 500 yrs M5 Pollitz RSQSim M5 M6 M6 M7 M7 norcal1
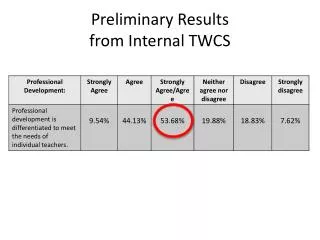
San Andreas Fault: Probability Distribution Functions of Inter-event Times, M >= 7.0 At Fort Ross At San Arano ALLCAL Red lines show paleoseismic preferred interevent times from UCERF2 VIRTCAL Note that the PDFs differ for different simulators for the same set of fault “strengths.” So each simulator needs individual tuning. RSQSim Zielke norcal1
Can Adjust Inter-Event Times by Changing Fault “Strengths” Probability Distribution Functions of Inter-event Times, M >= 6.5 (black), 7.0 (red) for ALLCAL, “tuned” by Steve Ward North Hayward Fault South Hayward Fault InitialN and S times about the same Using Initial values of fault strengths: Vertical red lines show paleoseismic preferred interevent times from UCERF2 Fault “strength” increased Fault “strength” decreased Shifted N to longer and S to shorter times Using Values of fault strengths “tuned” to match inter-event times: norcal4has more faults, including thrust faults
PDFs of Inter-event Times, Log-time scale Entire System ALLCAL VIRTCAL Pollitz RSQSim Zielke Plots all for 5 <= M <= Inf Blue curves are Poisson process with same average rate as data Note that different simulators allow different inter-event times. Dealing with aftershocks needs short times. norcal1 Omori’s Law gives a straight line
Conclusions • The simulators show general agreement on many statistical measures • However, significant differences exist between them • At this preliminary stage of the project most simulators have not been “tuned” to match observations of inter-event times, so they can do better for that once input fault “strengths” are varied • Many other statistical measures will be developed, for example to examine how often ruptures jump from one fault to another. We also study this for only two faults. • We are making good progress on an All California fault model, following this N California smaller example