Download
1 / 22
220 likes | 333 Views
Social Security, Medicare & the U.S. Budget by the Numbers. Robert Ricketts Frank M. Burke Chair in Taxation October 2010. Trend Lines: Revenues & Expenditures 2006-2010 (first 11 months each year). Explaining the Deficit: Change in U.S. Federal Tax Revenues 2008-2009.

E N D
Social Security, Medicare & the U.S. Budgetby the Numbers Robert Ricketts Frank M. Burke Chair in Taxation October 2010
Trend Lines: Revenues & Expenditures 2006-2010 (first 11 months each year)
Explaining the Deficit:Change in U.S. Federal Tax Revenues2008-2009
Present Value of “Social Insurance” Liabilities Projected Over Next 75 Years • “Social Insurance” programs account for just over 40% of the budget • As of the end of fiscal year 2009, the estimated net present value liability associated with these programs was $45 trillion: • Medicare – $38 trillion** (before HCR) • SS – $7.6 trillion • 2009 GDP = $14.265 trillion Source: Fiscal Year 2009 Financial Report of the United States, p. xiii (http://www.gao.gov/financial/fy2009/09frusg.pdf)
Present Value of “Social Insurance” Liabilities (cont) • PV of Projected GDP over next 75 years = $776 T • Net PV excess “Social Insurance” expenditures – 5.8% projected PV GDP • Social Security deficit – 1% GDP over next 75 years • Medicare deficit – 4.8% GDP over next 75 years • Medicare shortfall is almost 500% of SS shortfall in relative terms (as of FYE 2009)
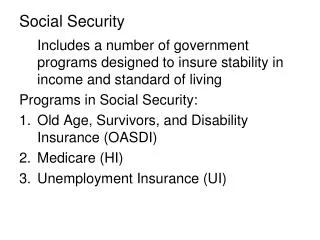
OverviewSocial Security as of FYE 2009 • Total Beneficiaries – 53 million • Retirees – 36 million • Survivors – 6 million • Disabled workers – 10 million • Employees paying into system – 136 million Source: 2010 Annual Report of the Board of Trustees of the Federal Old-Age and Survivors Insurance and Federal Disability Insurance Trust Funds (www.ssa.gov/OACT/TR/2010/index.html)
Overview (cont) • Total Revenues – $807 billion • Taxes (12.4% taxable payroll) – $689 billion • Interest ($2.5 trillion in Treasury bonds) – $118 billion • Total Expenditures – $686 billion Source: 2010 Annual Report of the Board of Trustees of the Federal Old-Age and Survivors Insurance and Federal Disability Insurance Trust Funds (www.ssa.gov/OACT/TR/2010/index.html) . Note that figures do not tie to CBO’s historical figures (www.cbo.gov/budget/budget.cfm).
Social Security Surpluses vs. Operating Deficit 1990-2009 • It has not always been this way … • The cumulative Social Security surplus for the period 1990—2009 was $2.5trillion • This represents around 23% of the total government debt ($11 Trillion) as of the end of fiscal year 2009
Annual Cost of SS Benefits • 2009 – benefits paid = 4.8% of GDP • 2009 – SS tax revenues = 5.76% of GDP • 2035 – projected benefits = 6.1% of GDP • After 2035, costs projected to decline to 5.9 % of GDP
“Fixing” Social Security • Cost Factors: • Retirement age • Life expectancy • Choice of inflation index (wage inflation is about 30% less than CPI) • Revenue Factors: • Tax rate • Tax base • Earnings ceiling • S corp pass-through income • “Carried interest” (e.g., hedge fund manager salaries) • Immigration • Taxation of benefits to recipients
Example: Lifting the Earnings Cap? • In 2007 (most recent data available), eliminating the cap on wages subject to FICA taxes would have increased tax revenues by $312 billion (enough to eliminate the 2008 total budget deficit) • Eliminating FICA on the first 20,000 of wages that year would have cost $69 billion in lost revenue • Thus, we could have increased tax revenues in 2007 by about $243 billion by eliminating FICA on the first $20,000 of wages, and eliminating the earnings cap on wages subject to FICA
SSA Projections • Annual cost rate: • 2010 – 13.09% of “taxable payroll” • 2035 – 17.43% of “taxable payroll” • Current tax rate (combined) – 15.3% of “taxable payroll”
SSA Projections For 75-year projection period, the shortfall in SS could be eliminated by: • Immediately reducing benefits by 12% • Increasing combined tax rate immediately by 1.84% • This would absorb about 5.9% of projected real wage growth over next 30 years • Note that rate increases over the past 30 years absorbed 6.8% of real wage growth • SS Trustees Report for 2010 projects average real wage in 30 years will be 48.7% higher than today
Overview 2010 Medicare Trustees Report Outlook “substantially” improved as a result of HCR: • HI Trust Fund solvency extended 12 years to 2029 • 75-year HI shortfall reduced to 0.66% of “taxable payroll” vs. 3.88% in 2009 • Note that taxable payroll is different for Medicare than for Social Security
How HCR Reduces Projected Medicare Shortfall • Medicare reimbursement inflation adjustment: • Reduced to rate of “total economy multifactor productivity growth” • Does not apply to physicians’ services or drugs • Rationale: future growth in healthcare costs will not be allowed to exceed productivity growth in broader economy
Medicare Trustee Projections • Hospital Insurance Trust Fund (HI) Deficit • 0.66% of “taxable payroll” • Note that there is no earnings ceiling on Medicare payroll tax • Beginning in 2029, dedicated revenues projected to be equal to 85% of HI costs and will decline slowly from there • Over 75 years, HI shortfall projected to be equal to: • 23% of Medicare payroll taxes • 16% of HI program costs
Medicare Trustee Projections • Medicare, Part B (SMI) – pays doctors’ bills and other outpatient expenses • Medicare, Part D – pays for prescription drugs • Combined cost = 1.9% of GDP in 2009 • Projected cost 2040: 3.5% of GDP • We have more work to do with regard to controlling prices for prescription drugs
Immediate Issue: Should we Extend the 2001-2003 Tax Cuts? CBO Budget Projections if Tax Cuts Expire and HCR Unchanged
Extending the 2001-2003 Tax Cuts CBO Projections Assuming Tax Cuts will be Extended and HCR Reforms will not be Fully Implemented
Gouging the Rich? Comparing effective total (state & federal) tax rates: • Source IRS 2008 individual income tax returns • All itemizers • Itemized deductions claimed for sales, property, state income and other taxes • Total federal income tax paid, including AMT, after allowable tax credits • FICA taxes paid conservatively estimated based on total salaries reported, assuming two workers with equal pay.
Effective Total Tax RatesLocal, State & Federal (incl. FICA)