Download
1 / 31
320 likes | 612 Views
An Innovative After-Treatment System for Diesel PM Removal Shuiliang Yao , Shin Yamamoto, Satoshi Kodama, Chieko Mine, Chihiro Fushimi, Yuichi Fujioka Research Institute of Innovative Technology for the Earth, Kyoto 619-0292, Japan Kazuya Naito, Kazuhiko Madokoro, Yoon-Ho Kim

E N D
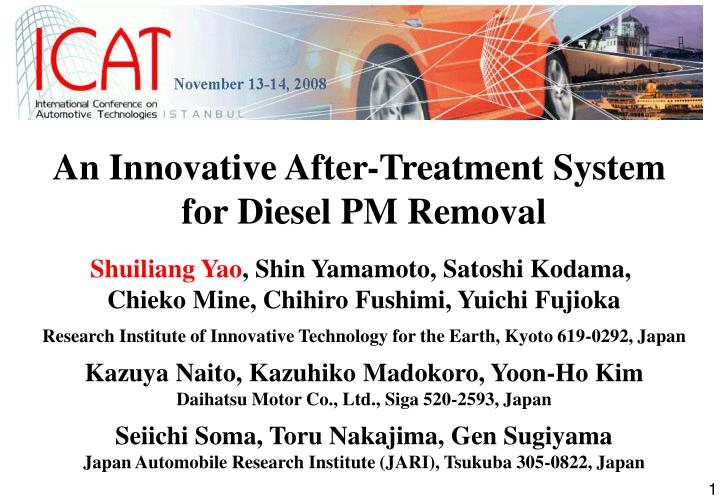
An Innovative After-Treatment System for Diesel PM Removal Shuiliang Yao, Shin Yamamoto, Satoshi Kodama, Chieko Mine, Chihiro Fushimi, Yuichi Fujioka Research Institute of Innovative Technology for the Earth, Kyoto 619-0292, Japan Kazuya Naito, Kazuhiko Madokoro, Yoon-Ho Kim Daihatsu Motor Co., Ltd., Siga 520-2593, Japan Seiichi Soma, Toru Nakajima, Gen Sugiyama Japan Automobile Research Institute (JARI), Tsukuba 305-0822, Japan
Background 1.1 Why diesel 24.3% ↓ CO2 emission (10-15 mode) (g-CO2/km) 53.6% ↓ 27.3% ↓ Total CO2 emission from Well to Wheel. Data from a report of JHFC, 2006. ☞ Diesel vehicles contribute reduction of CO2 green house gas.
④ ③ ② ① 1. Background 1.2 PM formation mechanism Ref:http://www.abo.fi/instut/pcg/
1. Background 1.3 PM journey in a human body ☞ An excess risk of lung cancer.
1. Background 1.4 PM properties SEM photo of diesel PM
1. Background 1.5 PM thermal combustion Heat flow PM weight CO and CO2 mass signals PM weight (%) and heat flow (mV) CO CO2 Temperature (oC) PM thermal combustion in oxygen-containing atmosphere. Experimental condition: O2 concentration: 10% (He balance), scanning temperature rate: 10 oC/min. ☞ 570 oC is required for PM thermal combustion.
1. Background 1.6 Emission standards 0.10 1997 NOx: 0.4 PM: 0.08 Japan 2002 NOx: 0.28 PM: 0.052 0.08 1997 NOx: 0.78 PM: 0.062 USA EU 0.06 2004 NOx: 0.19 PM: 0.037 PM (g/km) 0.04 2000(Euro 3) NOx: 0.50 PM: 0.05 2009(EURO 5) NOx: 0.18 PM: 0.005 2005(EURO 4) NOx: 0.25 PM: 0.025 0.02 2009 NOx: 0.05 PM: 0.005 2005 NOx: 0.14 PM: 0.013 0.00 0.0 0.1 0.2 0.3 0.4 0.5 0.6 0.7 0.8 2014(EURO 6) NOx: 0.08 PM: 0.005 NOx (g/km) Emission standards for light-duty vehicles.
1. Background 1.7 PM removal methods Gas in Gas out Gas before filtration Trapped PM SiC membrane Gas after filtration Photo of DPF samples Mechanism of PM removal using a diesel particulate filter (DPF). 1) Honeycomb structure. 2) Multi-membranes with 10s mm pores. 3) Regeneration by heating at > 600 oC. ☞
1. Background 1.7 PM removal methods Fuel penalty due to the use of DPF. Regeneration gap (oC)=regeneration temperature (600)-exhaust temperature Ref:K. Ohno. Doctoral thesis of Waseda University, 2006. ☞ Fuel penalty: 6-11% in 150-380 oC (typical for light-duty vehicles).
1. Background 1.8 PM removal methods – Our studies 12VDC power Pulse power supply High-voltage output Diesel engine (2L) Earth NOx reduction using EGR Plasma reactor (DBD reactor) A non-thermal plasma PM removal system. Targets for light-duty vehicles tested with JC08 mode
CO・CO2 sp3 bonding Combustion Discharges Surface oxidation + CO・CO2 1. Background 1.9 PM Plasma PM removal mechanism UV, O, OH, O3, NO2 contributed sp2 ratio decreases sp3 ratio increases sp2 bonding O3, NO2 contributed sp2 ratio increases sp3 ratio decreases Graphene with sp2 terminals Graphene with sp3 terminals Mechanism of PM oxidation/combustion by plasma discharges.
1. Background 1.10 Object of this study To characterize the DBD reactor using a chassis dynamometer systemunder JC08 mode.
2. Experimental 2.1 Chassis dynamometer system SOF/SOOT emission Particle # concentration (EEPS, CPC) NOx concentration HC concentration Air To CVS Full flow dilution tunnel DOC Diesel Engine Tail pipe Muffler Dynamo meter DBD reactor Experimental setup for emission measurements using a chassis dynamometer.
2. Experimental 2.2 Discharge system Alumina plate Silicone insulator Alumina spacer Al plate CTa V-P High voltage Alumina tube Exhaust gas Pulse power supply 12V dc Power Reactor frame CTc Oscilloscope Earth Assembly of the DBD reactor and discharge system.
Al electrode Silicone insulator Uneven Al2O3 plate Exhaust gas Al2O3 spacer Electrode Uneven Al2O3 plate Barrier Al electrode PM Silicone insulator Discharge space 2. Experimental 2.3 DBD reactor Basic structure of a DBD reactor.
2. Experimental 2.3 DBD reactor A B Side views of DBD reactor without (A) or with (B) discharges. ☞ 1) 21 pairs of electrodes. 2) Volume: 2.6 L. Basic structure of DBD reactor.
2. Experimental 2.4 Definitions Energy injection in Watts PM removal by PM weight emission measurement PM removal by PM number measurement using EEPS or CPC
2. Experimental 2.5 Conditions Test mode JC08, hot or cold start Diesel fuel JIS2 Discharge conditions Pulse frequency: 110~220 Hz Peak voltage: 0~8 kV Experiment cycles JC08Cold start x 2 cycles JC08Hot start x 7cycles Speed profile of JC08 mode.
3. Results & discussion 3.1 Typical discharge waveforms ☞ Pulse voltage: rise time: 15 ms, pulse width: 18 ms.
3. Results & discussion 3.2 Energy injection ☞ Energy injection is at a level of 0.85 J/pulse within 56 ms.
3. Results & discussion 3.3 Exhaust temperature & pressure loss ☞ 1) Pressure loss ≦ 10 kPa. 2) T: 150~160 oC.
3. Results & discussion 3.4 NOx emission NOx emission (g/km) Energy injection (W) ☞ NOx emission does not increase obviously.
3. Results & discussion 3.5 PM number concentration-EEPS PM concentration (#/cm3) Without discharges PM diameter (nm) With discharges (93W) PM diameter (nm) Elapsed time (one JC08 cycle) ☞ PM number concentration decreased due to plasma discharges.
3. Results & discussion 3.5 PM number concentration-EEPS Peak PM concentration used for removal calculation at various diameters PM concentration (x106 #/cm3) Speed (km/h) Elapsed time (min) ☞ PM number concentration decreased due to plasma discharges.
3. Results & discussion 3.6 PM number removal-EEPS data from peak PM concentration PM concentration (x106 #/cm3) PM removal (%) PM diameter (nm) ☞ 1) PM number removal is ~ 80% at a diameter >35 nm. 2) 15 nm particle number increased.
3. Results & discussion 3.7 PM number removal-CPC PM concentration (#/test) PM removal (%) Energy injection (W) ☞ PM number removal is 76% at 93 W, 90% at 400W.
3. Results & discussion 3.6 PM weight removal Post new long-term emission standard:0.005g/km PM removal (%) PM emission (g/km) PM SOOT SOF Energy injection (W) ☞ 1) Clear the post new long-term emission standard at ≧93 W. 2) SOOT can be removed effectively. 3) Plasma discharges have no effect on SOF removal.
3. Results & discussion 3.7 PM mass balance Table 1 PM mass balance in the DBD reactor *Calculated from mileage; ** Due to PM deposition in the DBD reactor estimated from results under a certain engine condition. ☞ PM removed: 3.285g by deposition: 1.25g (38%) by oxidation: 2.035g (62%)
3. Results & discussion 3.8 Fuel penalty DPF:6~11% Reactor structure improved Current reactor 3.4% at 93W 6.2% at 93W Total Total Fuel penalty decrease ratio (%) Fuel penalty decrease ratio (%) Due to energy injection Due to energy injection Due to pressure loss Due to pressure loss Energy injection (W) Energy injection (W) Estimation of fuel penalty due to pressure loss and electric power consumption. ☞ • 6.2% using current reactor. • 3.4% is realizable using improved reactor. • 2) The cost of the system is a problem. Calculation on: Engine efficiency: 40% Power (12V) efficiency: 80% Pulse power efficiency: 80%
4. Conclusion • PM can be removed by plasma discharges. The results are summarized as follows: • At 93 W, PM emission is 0.005 g/km, • satisfying Japanese post new long-term emission standard. • 2) PM is removed by oxidation (62%) and by deposition (38%). • 3) Pressure loss on the reactor and energy injection create fuel penalty. • At 93 W, total fuel penalty is 6.2% using the current reactor • can be reduced to 3.4% if using an improved reactor. • 4) The cost of the system is a problem.
Acknowledgments This work was supported by the New Energy Industrial Technology Development Organization (NEDO) under a government fund from the Ministryof Economy, Trade and Industry (METI), Japan. Special appreciation would be extended to: Prof. Y. Nihei at Tokyo University of Science, Prof. H. Fujimoto at Doshisha University, Prof. Y. Hori at the University of Tokyo and Prof. Y. Teraoka at Kyushu University.