Download
1 / 34
340 likes | 434 Views
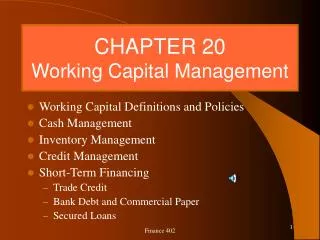
Chapter 11 – Part I Total Quality Management. COB 300 Busing. Problems Hidden by Inventory. Simplifying the Process. Plant layout Group technology U-shaped layout Reducing setup time Total preventive maintenance. Simplified Process. Quality and reliability Flexibility product

E N D
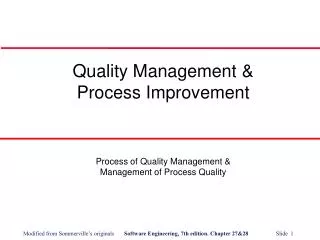
Chapter 11 – Part I Total Quality Management COB 300 Busing
Simplifying the Process • Plant layout • Group technology • U-shaped layout • Reducing setup time • Total preventive maintenance Simplified Process
Quality and reliability Flexibility product volume Dependability Asset utilization People utilization Cost minimization Strategy and JIT
Internally OrientedDefinitions of Quality • Quality is the degree to which a specific product conforms to a design or specification • Differences in quality amount to differences in the quantity of some desired ingredient or attribute
Externally OrientedDefinitions of Quality • Quality is fitness for use • Quality consists of the capacity to satisfy wants
A Definition of Quality Used by Many Companies Quality is consistently meeting or exceeding the customer’s needs and expectations.
Dimensions of Service Quality • Reliability • Responsiveness • Assurance • Empathy • Tangibles
Performance Features Reliability Conformance Durability Serviceability Aesthetics Perceived Quality Dimensions of Quality for Goods
Prevention Planning Procedures Training Appraisal Testing Inspection Audits Failure Internal Scrap and rework Retests Down time External Returns Warranty work Goodwill lost Lost sales Costs of Quality
W. Edwards Deming System causes most defects Joseph M. Juran Quality planning, quality control, quality improvement Philip Crosby Quality is free, zero defects Genichi Taguchi Taguchi methods, robust design The Background of TQM
Components of TQM • Focus on the customer • Everyone responsible for quality • Team problem solving • Employee training • Fact-based management • Philosophy of continuous improvement
Components ofContinuous Improvement • Standardize and document procedures • Assign teams to identify areas for improvement • Use methods analysis and problem-solving tools • Use the Plan-Do-Check-Act cycle • Document improved procedures
Baldridge Award • Baldridge Award Criteria for 00
ISO 9000 Standards 9000-1: Guidelines 9001: Design through installation and testing 9002: Production through installation and testing 9003: Distributors 9004-1: Model of quality management system
Comparing Baldrige,ISO 9000 and TQM • Baldrige • U.S. Quality Award • Focus on outcomes • ISO 9000 • International standards • Focus on documentation of processes • TQM • Organizational quality philosophy • Foundation of Baldrige criteria
Chapter 11 – Part II Quality Control COB 300 C - The Operations Dimension Busing
Causes of Variation • Random Causes • difficult or expensive to control • e.g., outside humidity, line voltage • Assignable Causes • easier to correct • e.g., employee error, new materials
Control Charts • Variables - concentrates on mean for some measurable characteristic. • diameter • length • Attribute - data is based on counts or the number of times we observe a particular event. • proportion defective/non-defective • go/no go • proportion pass/fail
Control Limits - Variables Charts X-Bar Chart R Chart
Factors for Control Limits(Slide 1 of 2) Sample of Size n A D D 2 3 4 2 3 4 5 6 7 8 9 10 1.880 1.023 0.729 0.577 0.483 0.419 0.373 0.337 0.308 0 0 0 0 0 0.076 0.136 0.184 0.223 3.268 2.574 2.282 2.114 2.004 1.924 1.864 1.816 1.777
Warning Conditions • Two successive points near limit • Run of five above or below mean • Trend • Erratic behavior
Process Control for Attributes Proportion defective: Number of defects per unit:
Homework • Chapter 11 – 4, 8, 9