Download
1 / 47
470 likes | 474 Views
The PARTNER 3 Trial investigates the safety and effectiveness of transcatheter aortic valve replacement (TAVR) compared to conventional surgery in low-risk patients with severe symptomatic aortic stenosis. This study aims to determine the optimal treatment for this patient population.

E N D
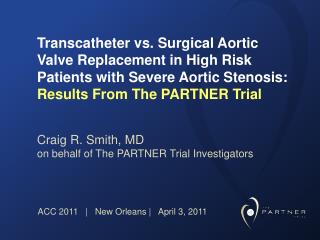
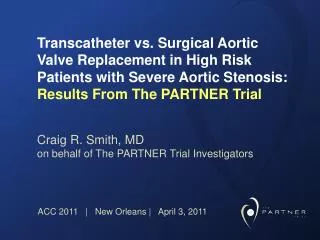
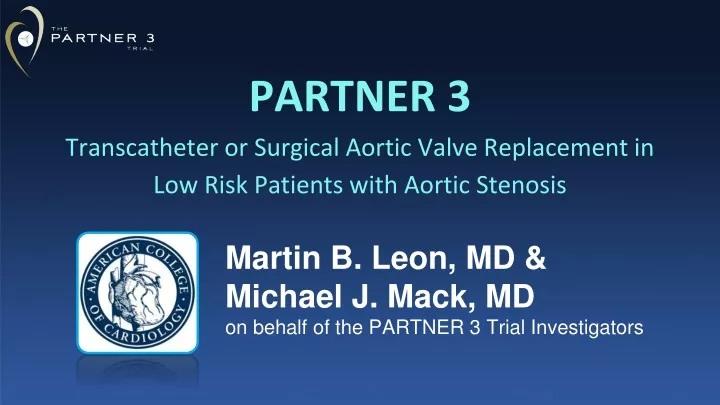
PARTNER3Transcatheter or Surgical Aortic Valve Replacement in Low Risk Patients with Aortic Stenosis Martin B. Leon, MD &Michael J. Mack, MDon behalf of the PARTNER 3 Trial Investigators
Disclosures - Martin B. Leon, MDACC 2019; New Orleans, LA; March 16-18, 2019 Within the past 36 months, I or my spouse/partner have had a financial interest/arrangement or affiliation with the organization(s) listed below. Financial Relationship Company • Research Support Abbott, Boston Scientific, Edwards Lifesciences, Medtronic • Consulting Fees* Abbott, Boston Scientific, Gore, Medtronic, Meril Life Sciences • Other Edwards Lifesciences** *Medical or scientific advisory board meetings ** Co-PI PARTNER 3 Trial; travel-related expenses only
Background (1) • Previous PARTNER studies have shown that TAVR was superior to standard therapy in extreme-risk patients and non-inferior to surgery in high- and intermediate-risk patients. • Over the past decade, technology enhancements and procedural refinements have reduced complications and improved clinical outcomes after TAVR. • The majority of AS patients treated with surgery have low surgical risk profiles and TAVR vs. surgery in such patients has not been investigated in rigorous clinical trials.
Background (2) ? PARTNER 1B PARTNER 3 • RCT 1:1 • vs. Standard Rx • N = 358 pts • RCT 1:1 • vs. Surgery • N = 1000 pts Low Risk Extreme Risk Interm Risk High Risk • RCT 1:1 • vs. SAVR • N = 699 pts • RCT 1:1 • vs. SAVR • N = 2032 pts PARTNER 2A PARTNER 1A
Purpose To compare the safety and effectiveness of the SAPIEN 3 TAVR system versus conventional surgery in patients with severe symptomatic aortic stenosis who are at low surgical risk.
PARTNER 3 Study Design Symptomatic Severe Aortic Stenosis Low Risk/TF ASSESSMENT by Heart Team (STS < 4%) 1:1 Randomization 1000 Patients Surgery(Surgical Bioprosthetic Valve) TAVR(SAPIEN 3 THV) Follow-up: 30 day, 6 mos, and annually through 10 years Primary Endpoint: Composite of all-cause mortality, stroke, or CV re-hospitalization at 1 year post-procedure
PARTNER3 Clinical Sites 65 sites 1 site 3 sites 1 site 1 site
ThePARTNER 3 Trial Top 5 Enrolling Sites David Brown and Michael Mack Heart Hospital Baylor Plano; Plano, TX 68 patients enrolled Robert Guyton and Vasilis Babaliaros Emory University; Atlanta, GA 52 patients enrolled SusheelKodali, Isaac George and TamimNazif Columbia University Med Center; NY, NY 41 patients enrolled Raj Makkar and Alfredo Trento Cedars-Sinai Med Center; Los Angeles, CA 35 patients enrolled Mark Russo and Bruce Haik Newark Beth Israel Med Center; Newark, NJ 34 patients enrolled
Study Leadership National Principal Investigators • Martin B. Leon, MD, Columbia University Medical Center, New York, NY • Michael J. Mack, MD, The Heart Hospital Baylor Plano, Plano, TX Steering Committee • Howard Herrmann, Samir Kapadia, Susheel Kodali, Martin B. Leon, Michael J. Mack,Raj Makkar, Craig R. Smith (chair), Wilson Szeto, Vinod Thourani, John Webb Data & Safety Monitoring Board • Cardiovascular Research Foundation, New York, NY; Joseph Carrozza, Jr., MD, chair Clinical Events Committee • Cardiovascular Research Foundation, New York, NY; Steven O. Marx, MD, chair CT Core Laboratory • The University of British Columbia; Jonathon Leipsic, MD, chair; Philipp Blanke, MD, chair Echocardiographic Core Laboratory • Quebec Heart & Lung Institute (Laval University); Philippe Pibarot, DVM PhD, chair • Cardiovascular Research Foundation, New York, NY; Rebecca Hahn, MD, chair Sponsor • Edwards Lifesciences, Irvine, CA
Key Inclusion Criteria Severe Calcific Aortic Stenosis • AVA ≤ 1.0 cm2 or AVA index ≤ 0.6 cm2/m2 • Jet velocity ≥ 4.0 m/s or mean gradient ≥ 40 mmHg, AND • NYHA Functional Class ≥ 2, OR • Abnormal exercise test with severe SOB, abnormal BP response, or arrhythmia, OR • Asymptomatic with LVEF < 50% Low Surgical Risk • Determined by multi-disciplinary heart team • STS < 4% • Adjudicated by case review board
Key Exclusion Criteria Anatomic • Aortic annulus diameter < 16 mm or > 28 mm (3D imaging) • Bicuspid valve (CT imaging) • Severe AR (> 3+) or MR (> 3+) • Severe LV dysfunction (LVEF < 30%) • Severe calcification of aortic valvar complex (esp. LVOT) • Vascular anatomy not suitable for safe femoral access • Complex CAD: ULM, Syntax score > 32, or not amenable for PCI • Low coronary takeoff (high risk for obstruction) Clinical • Acute MI within 1 month • Stroke or TIA within 90 days • Renal insufficiency (eGFR < 30 ml/min) and/or renal replacement Rx • Hemodynamic or respiratory instability • Frailty (objective assessment; > 2/4+ metrics)
SAPIEN Valve Evolution 14-16F 22-24F 16-20F 29 mm 23 mm 26 mm PARTNER 1 PARTNER 2 PARTNER 3 FDA Approval of Valve: 2011 2014 2015
Study Methodology • Every patient reviewed (including imaging studies) by multi-disciplinary heart team AND case review board • Baseline and 30-day neuro assessment in all patients; serial neurologist examinations and neuro-imaging for suspected neuro events • 3D cardiac imaging (CT or TEE) prior to randomization • Same day or staged concomitant PCI procedures (or surgery + CABG) were allowed if approved during case review • 100% CEC adjudication of all major endpoint events (VARC-2 definitions when applicable) • 10-year clinical and echocardiography follow-up in all patients
Primary Endpoint • Non-hierarchical composite of all-cause mortality, all strokes, or CV re-hospitalization at 1 year • Primary analysis was non-inferiority, followed by superiority • Analysis cohort was the ‘as-treated’ (AT) population, defined as all randomized patients in whom the procedure was initiated. • Multiple sensitivity analyses performed
Sample Size Calculation • Primary hypothesis:non-inferiority SAPIEN 3 vs. surgery for the primary endpoint at 1 year • Non-inferiority margin:6% (risk difference) • One-sided alpha:0.025 • Assumptions(for 1:1 randomization) • Event rate: 16.6% for Surgery and 14.6% for TAVR • Power: 90% • Sample size: 864 patients (increased to 1,000 patients for loss to follow-up, withdrawals and other contingencies)
Statistical Methods • Non-inferiority Testing for Primary Endpoint • Upper bound of the 95% CI for the risk difference (TAVR-surgery) less than the pre-specified non-inferiority margin of 6% • Superiority Testing for Primary Endpoint • If non-inferiority hypothesis met, superiority testing performed using a 2-sided alpha 0.05 • Superiority Testing for Secondary Endpoints • 1) Pre-specified in hierarchical order with multiplicity adjustments and 2) all others (P-values hypothesis generating)
Study Flow and Follow-Up 1520 patients with severe symptomatic AS at low surgical risk consented between March 25, 2016 and October 26, 2017 at 71 sites in the US, Canada, Japan, ANZ Excluded from Randomization N=520 Eligible for Enrollment and Randomized N=1000 at 71 sites • Anatomic exclusions (n=308) • Clinical exclusions (n=89) • Other exclusions (n=38) • Incomplete screening (n=85) TAVR N=503 Surgery N=497
Study PopulationsITT to AT Patient Cohorts Randomized N=1000 TAVR (ITT) N = 503 Surgery (ITT) N = 497 Procedure Initiated (AT) N = 496 Procedure Initiated (AT) N = 454
Patient Disposition As Treated Population N=950 TAVR Initiated (AT) N = 496 Surgery Initiated (AT) N = 454 1 Conversion to surgery 1 Aborted procedure Valve Implanted (VI) N = 495 Valve Implanted (VI) N = 453 4 Withdrawals Surgery with complete 30 day follow-up for primary endpoint N = 450/454 (99.1%) TAVR with complete 30-day follow up for primary endpoint N = 496/496 (100%) 1 Withdrawal 2 Missed visits 11 Withdrawals 1 Lost to follow-up TAVR with complete 1 year follow-up for primary endpoint N = 493/496 (99.4%) Surgery with complete 1 year follow-up for primary endpoint N = 442*/454 (97.4%) *4 patients who withdrew from the surgery arm are considered to have complete 1-yr follow-up b/c they had already experienced an endpoint event prior to withdrawing from the study. 98.4% Follow-up for Primary Endpoint
Baseline Patient Characteristics % or mean ± SD *p = 0.01
Baseline Echo and CT Characteristics % or mean ± SD
Procedural & Hospital Findings % or mean ± SD
Procedural ComplicationsIn-Hospital % or mean ± SD *Valve-in-valve
Primary Endpoint 20 HR [95% CI] = 0.54 [0.37, 0.79] Upper 95% CI of risk diff = -2.5% Surgery TAVR 15.1% Pnon-inferiority< 0.001 Psuperiority= 0.001 9.3% 10 8.5% Death, Stroke, or Rehosp (%) 4.2% 0 0 3 6 9 12 Months after Procedure Number at risk: 374 Surgery 454 408 390 381 377 451 TAVR 496 475 467 462 456
All-Cause Mortality 20 HR [95% CI] = 0.41 [0.14, 1.17] Surgery P = 0.09 TAVR 10 All-Cause Mortality (%) 2.5% 1.1% 1.0% 0 0.4% 0 3 6 9 12 Months from Procedure Number at risk: 427 454 445 438 433 431 Surgery 488 TAVR 496 494 494 493 492
All Stroke 20 HR [95% CI] = 0.38 [0.15, 1.00] Surgery P = 0.04 TAVR 10 All Stroke (%) 2.4% 3.1% 1.2% 0 0.6% 0 3 6 9 12 Months from Procedure Number at risk: 417 454 435 427 423 421 Surgery 484 TAVR 496 491 491 489 487
Death or Disabling Stroke 20 HR [95% CI] = 0.34 [0.12, 0.97] Surgery P = 0.03 TAVR 10 Death or Disabling Stroke (%) 1.3% 2.9% 1.0% 0 0.4% 0 3 6 9 12 Months from Procedure Number at risk: 426 454 444 436 432 430 Surgery 488 TAVR 496 494 494 493 491
Rehospitalization 20 HR [95% CI] = 0.65 [0.42, 1.00] Surgery P = 0.046 TAVR 11.0% 10 Rehospitalization (%) 6.5% 7.3% 3.4% 0 0 3 6 9 12 Months from Procedure Number at risk: 382 454 416 399 389 385 Surgery 453 TAVR 496 477 469 465 459
Primary Endpoint Sensitivity Analyses Intention-to-Treat Population 20 HR [95% CI] = 0.55 [0.37, 0.80] Surgery P = 0.002 TAVR 14.8% 8.8% 10 8.4% Death, Stroke, or Rehosp (%) 4.2% 0 0 3 6 9 12 Months after Procedure Number at risk: 374 Surgery 497 420 395 382 378 451 TAVR 503 478 469 462 456
Primary Endpoint Sensitivity Analyses Multiple Imputation *95% CI based on the Greenwood standard error WIN Ratio *95% CI and p-value is based on the Finkelstein and Schoenfeld approach
Primary Endpoint - Subgroup Analysis Event rates are KM estimates (%) -20% 10% 0 -10% 20% * P-value is for interaction TAVR Better Surgery Better
Pre-specified Secondary EndpointsSubject to Multiplicity Adjustment * P-value is Log-Rank test for items 1, 3, 5 and 6; P-value is Wilcoxon Rank-Sum Test for item 2; P-value is Fisher’s Exact test for item 4
Pre-specified Secondary EndpointsSubject to Multiplicity Adjustment * P-value is Log-Rank test for items 1, 3, 5 and 6; P-value is Wilcoxon Rank-Sum Test for item 2; P-value is Fisher’s Exact test for item 4
Other Secondary Endpoints Event rates are KM estimates (%) and p-values are based on Log-Rank test * Event rates are incidence rates and p-value is Fisher’s Exact test
Echocardiography Findings Mean Gradient Surgery 49.4 48.3 TAVR P < 0.001 Mean Gradient (mmHg) P < 0.001 13.7 12.8 11.6 11.2 Baseline 30D 1 Year No. of Echos 441 426 390 483 490 469 P-values are based on the ANCOVA for TAVR vs Surgery adjusted by baseline.
Echocardiography Findings Aortic Valve Area 1.8 1.8 Surgery TAVR 1.7 1.7 P = 0.05 P = 0.04 0.8 Valve Area (cm2) 0.8 Baseline 30D 1 Year No. of Echos 423 395 371 458 470 446 P-values are based on the ANCOVA for TAVR vs Surgery adjusted by baseline.
The PARTNER Trials Valve Size Distribution 26mm 23mm 29mm 20mm 0.5 0.9 29mm 27mm 25mm 23mm 21mm 19mm % of Patients % of Patients 17mm 3.9 2.2 0.1
Paravalvular Regurgitation ≥ mod PVR: P = 0.13 ≥ mod PVR: P = 1.00 0.6 0.5 0.8 0 ≥ Moderate Mild None/Trace Percentage of Patients 30 Days 1 Year P-values are based on the Wilcoxon rank-sum test.
Paravalvular Regurgitation mild PVR: P < 0.001 mild PVR: P < 0.001 0.6 0.5 0.8 0 ≥ Moderate Mild None/Trace Percentage of Patients 30 Days 1 Year P-values are based on the Wilcoxon rank-sum test.
Functional Assessments NYHA Class II/III/IV KCCQ Overall Summary Score Six-Minute Walk Distance P < 0.01 P = 0.19 P < 0.01 P = 0.76 P < 0.01 P = 0.94 Percentage of Patients (%) Percentage Change from Baseline (%) 30 Days 1 Year 30 Days 1 Year 30 Days 1 Year Surgery Surgery Surgery TAVR TAVR TAVR P-values are based on the ANCOVA for TAVR vs Surgery adjusted by baseline. P-values are based on Fisher’s Exact test.
The PARTNER 3 TrialStudy Limitations • Results only reflect 1-year outcomes; long-term assessment of structural valve deterioration is required • 10-year clinical and echocardiographic FU planned in all patients • Results only apply to the enrolled AS population (e.g. bicuspid aortic valves, non-suitable for TF, and complex CAD excluded)
The PARTNER 3 TrialConclusions (1) In a population of severe symptomatic aortic stenosis patients who were at low surgical risk, TAVR (using the SAPIEN 3 valve) compared to surgery: • Significantly reduced the primary endpoint of death, stroke, or rehospitalization by 46% at 1-year. • Components of the primary endpoint favored TAVR, both at 30 days and 1 year • Multiple sensitivity analyses confirmed robustness of the primary endpoint findings
The PARTNER 3 TrialConclusions (2) • Secondary endpoints adjusted for multiple comparisons indicated that TAVR reduced new-onset AF, index hospitalization days, and a measure of poor treatment outcome (death or low KCCQ score at 30 days). • Other secondary endpoint analyses also showed reduced bleeding after TAVR and no differences in the need for new permanent pacemakers, major vascular complications, coronary obstruction, and mod-severe PVR. • Some secondary endpoints favored surgery, including reduced new LBBB, reduced mild PVR, and lower aortic valve gradients.
The PARTNER 3 TrialConclusions (3) • TAVR had more rapid post-procedure improvement in patient-oriented functional indices, including NYHA class, 6-minute walking distance, and KCCQ scores.
The PARTNER 3 TrialClinical Implications • Based upon these findings, TAVR, through 1-year, should be considered the preferred therapy in low surgical risk aortic stenosis patients! • PARTNER randomized trials over the past 12 years, clearly indicate that the relative value of TAVR compared with surgery is independent of surgical risk profiles. • The choice of TAVR vs. surgery in aortic stenosis patients should be a shared-decision making process, respecting patient preferences, understanding knowledge gaps (esp. in younger patients), and considering clinical and anatomic factors.
The PARTNER 3 Trial PARTNER 1B PARTNER 3 • RCT 1:1 • vs. Standard Rx • N = 358 pts • RCT 1:1 • vs. Surgery • N = 1000 pts Low Risk Extreme Risk Interm Risk High Risk • RCT 1:1 • vs. SAVR • N = 699 pts • RCT 1:1 • vs. SAVR • N = 2032 pts PARTNER 2A PARTNER 1A