Download
1 / 42
430 likes | 1.03k Views
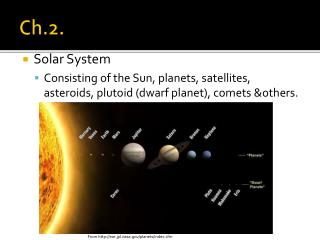
Fetter, Ch. 2. 2 .1 Evaporation 2 .2 Transpiration 2 .3 Evapotranspiration 2 .4 Condensation 2 .5 Formation of Precipitation 2.6 Measurement of Precipitation and Snow 2.7 Effective Depth of Precipitation 2.8 Events During Precipitation 2.9 Stream Hydrographs

E N D
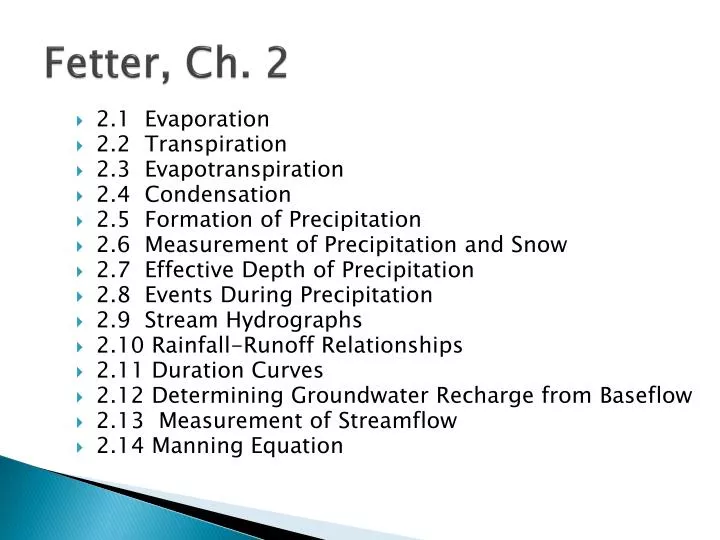
Fetter, Ch. 2 • 2.1 Evaporation • 2.2 Transpiration • 2.3 Evapotranspiration • 2.4 Condensation • 2.5 Formation of Precipitation • 2.6 Measurement of Precipitation and Snow • 2.7 Effective Depth of Precipitation • 2.8 Events During Precipitation • 2.9 Stream Hydrographs • 2.10 Rainfall-Runoff Relationships • 2.11 Duration Curves • 2.12 Determining Groundwater Recharge from Baseflow • 2.13 Measurement of Streamflow • 2.14 Manning Equation
Fetter, Ch. 2 • 2.1 Evaporation • 2.2 Transpiration • 2.3 Evapotranspiration • 2.4Condensation • 2.5 Formation of Precipitation • 2.6 Measurement of Precipitation and Snow • 2.7 Effective Depth of Precipitation • 2.8 Events During Precipitation • 2.9 Stream Hydrographs • 2.10 Rainfall-Runoff Relationships • 2.11 Duration Curves • 2.12 Determining Groundwater Recharge from Baseflow • 2.13 Measurement of Streamflow • 2.14 Manning Equation
Evaporation • “free water evaporation” • measured with land pan • effected by: • rainfall overflow • rainfall splash • wildlife • wind Class A Evaporation Pan
Evapotranspiration (ET) • ET = Evaporation + Transpiration • potential vs. actual ET • ET (potential) = A + R – P • ET (actual) = R – P
Evapotranspiration • measured with lysimeter
Evapotranspiration • fine soils • ample soil moisture • warm summers • cool summers • coarse soils • limited soil moisture • warm/dry summers • cool/moist winters
Evapotranspiration • fine soils • ample soil moisture • warm summers • cool winters +SM -SM -SM +SM • coarse soils • limited soil moisture • warm/dry summers • cool/moist winters
Condensation • Humidity • absolute humidity (g/m3) • saturation humidity (g/m3) • varies with temperature • relative humidity (%) • dew point (degrees F or C)
Condensation Supersaturation Undersaturation
Fetter, Ch. 2 • 2.1 Evaporation • 2.2 Transpiration • 2.3 Evapotranspiration • 2.4 Condensation • 2.5 Formation of Precipitation • 2.6 Measurement of Precipitation and Snow • 2.7 Effective Depth of Precipitation • 2.8 Events During Precipitation • 2.9 Stream Hydrographs • 2.10 Rainfall-Runoff Relationships • 2.11 Duration Curves • 2.12 Determining Groundwater Recharge from Baseflow • 2.13 Measurement of Streamflow • 2.14 Manning Equation
Formation of Precipitation • Adiabatic expansion • warm air holds more water than cold air • Air rises in atmosphere, expands, cools and condenses water.
Formation of Precipitation • Orographic Effect
Measurement of Precipitation and Snow Rain gage On roof of Harris Hall, Marshall University, Huntington, WV Click here for station data
Measurement of Precipitation and Snow • Water depth approximately 10% of snow depth. • Snow represents storage of water—delayed runoff. • In mountainous regions, significant part of annual runoff can be snowmelt. • Global warming is altering water budgets in some of these areas.
Fetter, Ch. 2 • 2.1 Evaporation • 2.2 Transpiration • 2.3 Evapotranspiration • 2.4 Condensation • 2.5 Formation of Precipitation • 2.6 Measurement of Precipitation and Snow • 2.7 Effective Depth of Precipitation • 2.8 Events During Precipitation • 2.9 Stream Hydrographs • 2.10 Rainfall-Runoff Relationships • 2.11 Duration Curves • 2.12 Determining Groundwater Recharge from Baseflow • 2.13 Measurement of Streamflow • 2.14 Manning Equation
Effective Depth of Precipitation • Arithmetic Average • Thiessen Method • Isohyetal Method
Fetter, Ch. 2 • 2.1 Evaporation • 2.2 Transpiration • 2.3 Evapotranspiration • 2.4 Condensation • 2.5 Formation of Precipitation • 2.6 Measurement of Precipitation and Snow • 2.7 Effective Depth of Precipitation • 2.8 Events During Precipitation • 2.9 Stream Hydrographs • 2.10 Rainfall-Runoff Relationships • 2.11 Duration Curves • 2.12 Determining Groundwater Recharge from Baseflow • 2.13 Measurement of Streamflow • 2.14 Manning Equation
Events During Precipitation fp = fc + (f0 – fc) e-kt PR PR < fp fp f0 > PR > fp PR > f0
Events During Precipitation • Fate of infiltrated water • throughflow • interflow • baseflow
Events During Precipitation Throughflow re-emerges at surface as “return flow”
Events During Precipitation • More storage available • in form of soil moisture • Minimal overland flow • Lower slope of water table • Low stream flow • Less storage available • in form of soil moisture • Increased overland flow • Higher slope of water table • Higher stream flow
Fetter, Ch. 2 • 2.1 Evaporation • 2.2 Transpiration • 2.3 Evapotranspiration • 2.4 Condensation • 2.5 Formation of Precipitation • 2.6 Measurement of Precipitation and Snow • 2.7 Effective Depth of Precipitation • 2.8 Events During Precipitation • 2.9 Stream Hydrographs • 2.10 Rainfall-Runoff Relationships • 2.11 Duration Curves • 2.12 Determining Groundwater Recharge from Baseflow • 2.13 Measurement of Streamflow • 2.14 Manning Equation
Stream hydrograph Single storm event
Hydrograph Separation D = A 0.2
A normally gaining stream can become a losing stream during storm event
A normally gaining stream can become a losing stream during storm event
Duration Curves What geologic conditions would explain differences?
Determining GW Recharge from Baseline Recession • Baseflow recession equation: Q = Q0 e-at
Determining GW Recharge from Baseline Recession Q = Q0 e-at Semilog plot
Semi-log plots Q = Q0 e-at Semilog plot 4 3 log Q = Q0 e-at 2 log 1
Determining GW Recharge from Baseline Recession Vtp = Q0t1/2.3026 ~ (Q0– 0.1Q0) t1/2 Recession 1 Recession 2 Q0-2 Q0-1 Vtp-2 Vtp-1 0.1Q0-2 0.1Q0-1 t1-1 t1-2 Vt-1= remaining potential discharge Recharge to aquifer = Vtp-2 - Vt-1
A normally gaining stream can become a losing stream during storm event Water table position at start of baseline recession Vtp Vtp Water table position at start of baseline recession
Fetter, Ch. 2 • 2.1 Evaporation • 2.2 Transpiration • 2.3 Evapotranspiration • 2.4 Condensation • 2.5 Formation of Precipitation • 2.6 Measurement of Precipitation and Snow • 2.7 Effective Depth of Precipitation • 2.8 Events During Precipitation • 2.9 Stream Hydrographs • 2.10 Rainfall-Runoff Relationships • 2.11 Duration Curves • 2.12 Determining Groundwater Recharge from Baseflow • 2.13 Measurement of Streamflow • 2.14 Manning Equation
Measurement of Streamflow Stream Discharge (L3/T) = Area (L2) x Velocity (L/T) Stream Discharge (L3/T) = Width (W) x Depth (L) x Velocity (L/T) Stream Discharge, Q (ft3/s) = Width (ft) x Depth (ft) x Velocity (ft/s) W D
Measurement of Streamflow Price type current meter for measuring stream velocity
Measurement of Streamflow 0.6 of average depth water surface average depth