Download
1 / 16
190 likes | 501 Views
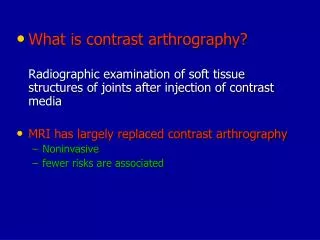
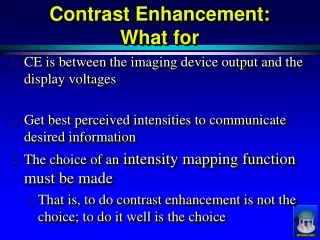
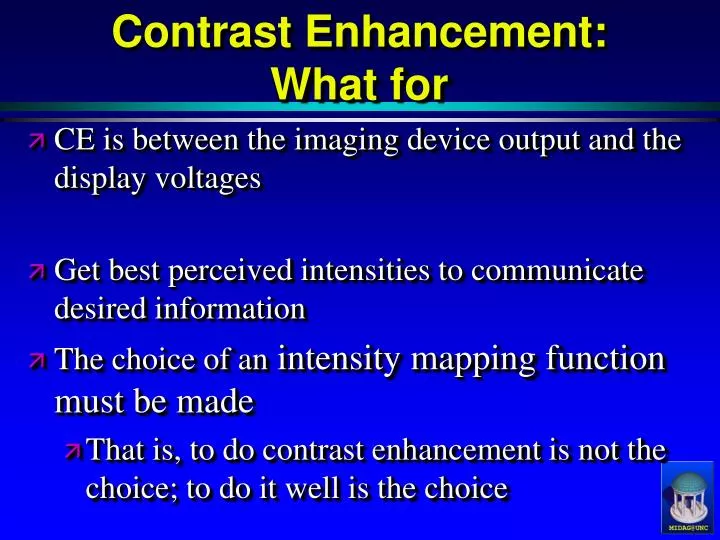
Contrast Enhancement: What for. CE is between the imaging device output and the display voltages Get best perceived intensities to communicate desired information The choice of an intensity mapping function must be made

E N D
Contrast Enhancement: What for • CE is between the imaging device output and the display voltages • Get best perceived intensities to communicate desired information • The choice of an intensity mapping function must be made • That is, to do contrast enhancement is not the choice; to do it well is the choice
In order to see the dark areas, the light looks over exposed.
Contrast Enhancement: Two General Strategies • Optimize information transmission via intensity mappings • Histogram as probability • Information theoretic argument leads to uniform probability distribution, so histogram flattening • Optimize contrast at spatial scales where most important information on object lies • Smaller scales are where object boundary info is dominant; at yet smaller scales noise is dominant
Contrast Enhancement:Techniques • Global vs. Local • Global • Intensity mappings • Intensity Windowing • Histogram Equalization • Achieving other histograms • Optimize contrast at boundary • Scale decomposition and then magnification of components at appropriate scales (e.g., MUSICA) • Unsharp Masking
Contrast Enhancement:Techniques • Global vs. Local • Locally adaptive • Intensity mapping • Adaptive Histogram Equalization • Optimize contrast at boundary • Geometry-limited diffusion
Intensity Windowing • Dedicate the range of display intensities to a limited window of recorded intensities. • Moves perceived object boundaries.
Unsharp Masking • Inew = α · (Gsmall*I – Gbig*I) + Gbig*I • Adds detail to a background image. • Amplifies Mach bands. • MUSICA – Multiple level-of-detail images, combination of which forms result.
Global Histogram Equalization • Theory: Information cleared up is maximized if the image has maximum uncertainty, i.e. a flat histogram • Intensities are mapped to their rank in the image. • Does not account for human contrast sensitivity, which is local.
Adaptive Histogram Equalization • Intensities are mapped to their rank in the contextual region (window). • Enhances noise in smooth regions • Correction: limit the slope of the intensity mapping.
Bilateral Filtering: VCD and form system • Think: form system input to diffusion process, and diffusion. • Blurs within boundary by using a weighting function that is the product of two Gaussians: • Gaussian with a spatial kernel: closer pixels have higher weight. • Gaussian in the intensity domain: higher weights for pixels with similar intensities. • Perona and Malik, 2002
Test Question: • Which row(s) show local histogram equalization and which show the global? How does the difference manifest itself on the spine?
Test Question: a. The doctors would like to diagnose a renal disorder that manifests itself in CT as a slight abnormality in a small region of the kidney image. 1. What kind of techniques may be applicable: list them. 2. If the abnormality is a matter of shape, why would windowing be a bad idea? ans: contrast enhancement on a small scale. Local techniques are windowing, adaptive histogram equalization and derivatives. ans: during windowing, isocontours of intensity move in the image. This may distort the perceived shapes in the image.
Test Question: b. The doctors wish to diagnose a disease that causes distant large areas of the image to slightly change intensities with respect to one another when they are usually identical. Name a technique that may work to enhance this effect in the image and why. ans: windowing may work. The min and max of the window could be set so that one area is very dark and the other is very bright. The high contrast would be noticeable to the doctor.
That’s It! Thank You. • Try it out: fspecial, imfilter, imshow, imhist, histeq, conv2 • Matlab example. • midag.cs.unc.edu • Pizer SM, Hemminger BM, Johnston, “Display of Two Dimensional Images”, in Image-Processing Techniques for Tumor Detection, edited by Strickland. 2002 Marcel Deckker, Basel, Switzerland. ISBN 0-8247-0637-4. s = double(imread(‘moon.tif')); s = s/max(max(s)); figure, imshow(s, [min(min(s)) max(max(s))]); h = fspecial('gaussian', [20 20], 4); sb = imfilter(s, h); figure, imshow(sb, [min(min(sb)) max(max(sb))]); sb = sb/max(max(sb)); sd = s - sb; figure, imshow(sd, [min(min(sd)) max(max(sd))]); news = 4*sd + sb; figure, imshow(news);
Matlab histogram equalization s = double(imread(‘moon.tif”)); figure, imshow(s, [min(min(s)) max(max(s))]); x = reshape(s, prod(size(s)),1); [n,y] = hist(x,0:255); n = n/sum(n); cn = cumsum(n); figure, plot(y,n,y,cn); J = cn(s+1); figure, imshow(J, [min(min(J)) max(max(J))]);