1 / 3

TABLE 6.1 LFP Rates U.S. Adult Females by Marital Status, 1900–2002 (% )

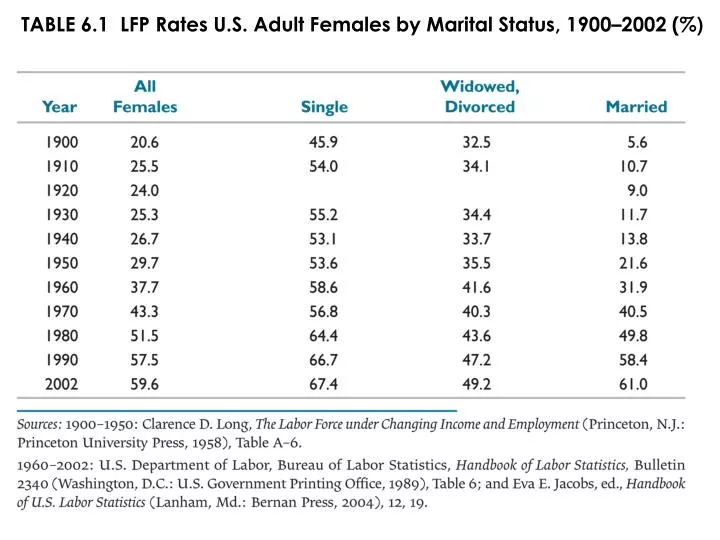
TABLE 6.1 LFP Rates U.S. Adult Females by Marital Status, 1900–2002 (% ). TABLE 6.2 LFP Rates U.S. Males, by Age, 1900–2002 (%). TABLE 6.3 LFP Rates of Women and Older Men, Selected Countries, 1965–2002 (%).

louis
Download Presentation

TABLE 6.1 LFP Rates U.S. Adult Females by Marital Status, 1900–2002 (% )

An Image/Link below is provided (as is) to download presentation Download Policy: Content on the Website is provided to you AS IS for your information and personal use and may not be sold / licensed / shared on other websites without getting consent from its author. Content is provided to you AS IS for your information and personal use only. Download presentation by click this link. While downloading, if for some reason you are not able to download a presentation, the publisher may have deleted the file from their server. During download, if you can't get a presentation, the file might be deleted by the publisher.

E N D

Presentation Transcript


  1. TABLE 6.1 LFP Rates U.S. Adult Females by Marital Status, 1900–2002 (%)

  2. TABLE 6.2 LFP Rates U.S. Males, by Age, 1900–2002 (%)

  3. TABLE 6.3 LFP Rates of Women and Older Men, Selected Countries, 1965–2002 (%)

More Related