Download
1 / 27
270 likes | 525 Views
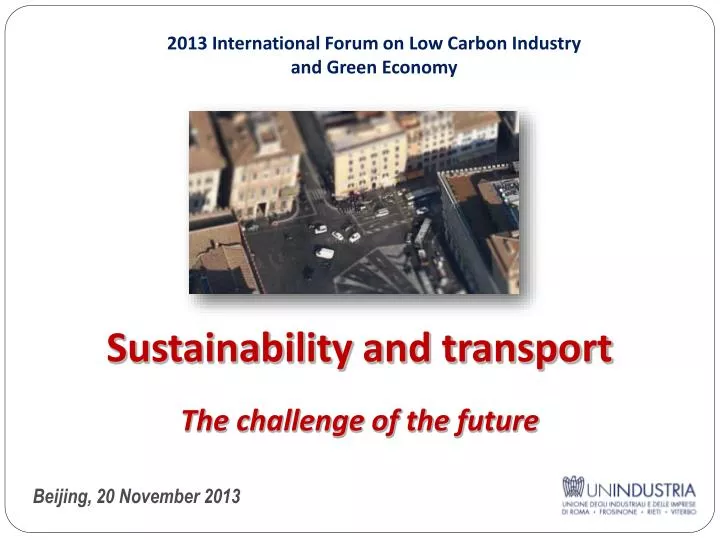
2013 International Forum on Low Carbon Industry and Green Economy. Sustainability and transport The challenge of the future. Beijing , 20 November 2013. SUMMARY THE TRANSPORT CHALLENGES CURRENT SCENARIO EUROPEAN POLICY FOR SUSTAINABLE TRANSPORT URBAN AREAS THE "Logeco“ PROJECT.

E N D
2013 International Forum on Low Carbon Industry and Green Economy Sustainability and transport The challenge of the future Beijing, 20 November 2013
SUMMARY THE TRANSPORT CHALLENGES CURRENT SCENARIO EUROPEAN POLICY FOR SUSTAINABLE TRANSPORT URBAN AREAS THE "Logeco“ PROJECT
THE TRANSPORT CHALLENGES FASTER CHEAPER-MORE EFFICIENT TRADITIONAL MORE SUSTAINABLE MORE ENVIRONMENTALLY FRIENDLY MODERN
ITALY-CHINA: TWO COUNTRIES NOW CLOSER Italy-China XIII Century - 3 ½ years Italy-China-XXI century 12 hours ____Nicolo and Matteo Polo 1255-69 ____Marco Polo (with Polo brothers) 1272-95 ____Marco Polo
SHARE OF TRADE BETWEEN GEOGRAPHIC REGIONS IN WORLD TRADE (2011) Europe-CIS 3,6% North America-Europe 4,8% CIS Cis-Asia 1,3% North America-Asia 7,8% Europe North America South and Central America- Africa 1.4% Europe- Middle East 2,0% Europe- Africa 2.3% Europe-Asia 8.8% North America-South and Central America 2.1% North America- Middle East 1.0% Middle East Asia Middle East-Asia 5,1% South and Central America-Asia 2.0% Africa North America- Africa 0,8% Africa-Asia 1,7% South and central America Source: WTO Secretariatestimates
FORECASTED PASSENGERS INCREASE AT THE AIRPORT OF ROME (2044) CIS N/A 4,7% 5,6% IATA1 Boeing 2 Intra-EUROPA Airbus3 Nord America IATA1 Boeing2 Airbus3 4,4% 3,6% 3,1% IATA1 Boeing2 Airbus3 4,3% 3,5% 3,7% Middle East IATA1 6,6% Boeing2 5,0% Airbus3 5,4% Africa Sud America Asia-Pacific IATA1 Boeing2 Airbus3 6,8% 4,8% 5,25)% 5,8% IATA1 Boeing2Airbus3 6,7% 4,94% 4,1% IATA1 Boeing2Airbus3 4,8% 5,1% Fonte:IATA 2012,Airbus 2012,Boeing20121) IATA: CAGR2012-2016Solo intra-regionale| 2)Boeing:CAGR 2012-2032| 3) Airbus: CAGR 2011-2031|4) MediapesataN.E.Asia-S.E. Asia-S.Asiasu valoritrafficopax2012| 5) Solo NordAfrica
+28% TRANSPORT AND THE ENVIRONMENT • The transport sector is crucial for the socio-economic development in industrialized countries. • Transport is the most energy-intensive sector, and also the one with the greatest growth in emissions in recent years • Energy use in the transport sector will increase by 25% • Unsustainable development imposes significant costs on society in terms of economic and social impact Transport Services Agricolture Residential RestofIndustry Energy intensive industry Source: European Energy and Transport - Trends to 2030 Update 2007 – EU Commission
ANNUAL GREENHOUSE GAS EMISSIONS BY SECTOR • Transport is responsible for almost a seventh of greenhouse gas emissions globally • Of these emissions, almost two thirds are the result of passenger travel while the rest is due to freight Shares of sources of global greenhouse gas emissions in 2010 by main sector (in CO2e using GWP values as used for UNFCCC/Kyoto Protocol reporting). Source: JRC/PBL (2012) (EDGAR 4.2 FT2010)
CARBON DIOXIDE EMISSIONS BY SECTOR AND SOURCE Commercial 1,042 MMT Industrial 1,503MMT Residential 1,233 MMT Transportation 1,865 MMT 2010 Carbon Dioxide Emissions by Sector and Source Petroleum 2,343 MMT Other 12MMT Coal 2,006 2MMT Natural Gas 1,282 MMT
42 CITIES IN THE WORLD HANDLE MORE THAN 10.000 LONG HAUL PASSENGERS PER DAY 2012AviationMega-Cities 0.8M Daily Passengers: Long Haul traffic to /from/via Mega Cities traffic 42 Aviation Mega- cities 93% of long-haul traffic on routes to/from/via 42 cities • >50 000 daily long-haul passengers • >20 000 daily long-haul passengers • >10 000 daily long-haul passengers Source: GMF 2013; Cities with more than 10,000 daily passengers Long haul traffic: flight distance >2,000nm, excl. domestic traffic Long-haul traffic is concentrated on a few main aviation centres 10
THE SHIPS ARE GETTING BIGGER Through the commissioning of ever larger ships, shipping companies achieve economies of scale, reduce unit costs and expanding the value chain This phenomenon produces the need for continuous adaptation of the technical standards of port infrastructure Size growth of cruise ships of larger capacity Size growth of container ships 11
SUSTAINABLE TRANSPORT • The European Union’s Ministers of Transport adopted this definition: • A sustainable transport system is one that: • allows the basic access and development needs of individuals, companies and societies to be met in a manner consistent with human and ecosystem health, and promises equity within and between successive generations • is affordable, operates fairly and efficiently, offers choice of transport mode, and supports a competitive economy, as well as balanced regional development • limits emissions and waste within the planet’s ability to absorb them, uses renewable resources at or below their rates of generation, and, uses non-renewable resources at or below the rates of development of renewable substitutes while minimizing the impact on land and the generation of noise 12
A VISION FOR A COMPETITIVE AND SUSTAINABLE TRANSPORT SYSTEM • The transport industry in itself represents an important part of the economy: in the EU it directly employs around 10 million people and accounts for about 5% of GDP • Curbing mobility is not an option • New transport patterns, according to which larger volumes of freight and greater numbers of travelers are carried jointly to their destination by the most efficient (combination of) modes • Improving the energy efficiency performance of vehicles across all modes. Developing and deploying sustainable fuels and propulsion systems • Optimizing the performance of multimodal logistic chains • Using transport and infrastructure more efficiently through use of: • improved traffic management and information systems • advanced logistic and full development of an integrated European railway market • undistorted pricing etc.
THE EUROPEAN TRANSPORT NETWORK Nodes network 15
REDUCTION OF CO2 EMISSIONS In 2012, high-speed trains have moved 25 million travelers preventing more than 600 thousand tons of CO2 emission Equal to the contribution that would have given a forest of 6 million trees for 10 years 16
THE CARBON INTENSITY OF DIFFERENT TRANSPORT MODES, PER PASSENGER-KILOMETER The Carbon lntensity ofTravel: g C02e/pkm Large Car (l 5 MPG) Long Flight (business) Medium Car (25 MPG) LocalBus (US) Motorbike (50 MPG) Long Flight (economy) Small Car (35 MPG) Electric Car (US grid) Short Flight (economy) Heavy Rail (US) Hybrid Car (45 MPG) Scooter (80 MPG) Coach (US) Metro (NYC) Electric Car (Solar) School Bus (US) Eurostar Rail (France) Cycling Napoli-Milano Napoli-Venezia 17 lndirectfuel Manufacturing Directfuel
THE CARBON INTENSITY OF DIFFERENT TRANSPORT MODES, PER PASSENGER-KILOMETER CO2 emissions of European fright trains amount to 29 gr for each ton-km of fright CO2 emissions for heavy Euro 5 transport vehicles amount to 81 gr for each ton-km of fright In the case of transport by heavy Euro 5, the related emissions amounted to 81 grams -64% 29 gr. CO2 +179% 81 gr. CO2 per 1 KM 18 Sources: Eurispes, EcotransIT
URBAN AREAS • cities consume on average between 60% and 80% of the World production of energy • are responsible for the majority of greenhouse gas emissions • over the next 20 years, the percentage of the world population living in cities will increase from 50% to 59% • cities are the primary cause of co2 emissions • Trafficjams • Conflictwithpedestrians • Emissions (PM, GHG) and noise • Safety • Economicefficiency The solution passes lies in the implementation of the “smart city“ the term smart city identifies an urban reality in which intelligent solutions are implemented aimed at the sustainable development of the area 19
A STRATEGY FOR URBAN AREAS In order to transform the transport sector and create more inclusive access through the development of transport infrastructure and services it will be important to: avoid the need for unnecessary motorized trips through smarter land use and logistics planning shift the transport of goods and persons to more efficient modes improve the efficiency and environmental performance of transport systems by improved vehicle, fuel, and network operations and management technologies 20
LOGECO a project for Roma Electric VehicleEcosystem
THE "LOGECO" PROJECT FOR THE URBAN DISTRIBUTION OF GOODS parking diesel vehicles transfer vehicles freight consolidation electric vehicles services 23
LOGECO • Two electric vehicles run about 1000 km over two months • Avg speed: 6 – 8 km/h • Avg consumption: 0,34 kWh/km • Avg use of capacity: 23%/day • Saved CO2: 355 kg 24
LOGECO DEVELOPMENTS new phase of experimentation with more vehicles and new supply chains identification of areas for urban logistics dedicated to the different distribution chains and consolidation of goods It is estimated that the application of the model in Rome can save 10,000 movements per year 9,000 T CO2 per year http://www.logeco.it/
TECHNOLOGY FOR SUSTAINABILITY Thanks to the use of ICT functionally related industries operating in the transportation sector can eventually form a proper “System” Logistics Road Car parking Taxis Electric cars Bikes Bus/coach Metro/tram Train Passenger information Location Traffic Availability 26