Download
1 / 12
120 likes | 263 Views
Figure 13.1 A mercury droplet, shown here in cross section, steadily grows as mercury slowly flows from the supporting capillary tube. Figure 13.2 Simple electro-capillary curve at a mercury electrode. The simplicity of such a curve is often impaired by the presence of adsorbing species.

E N D
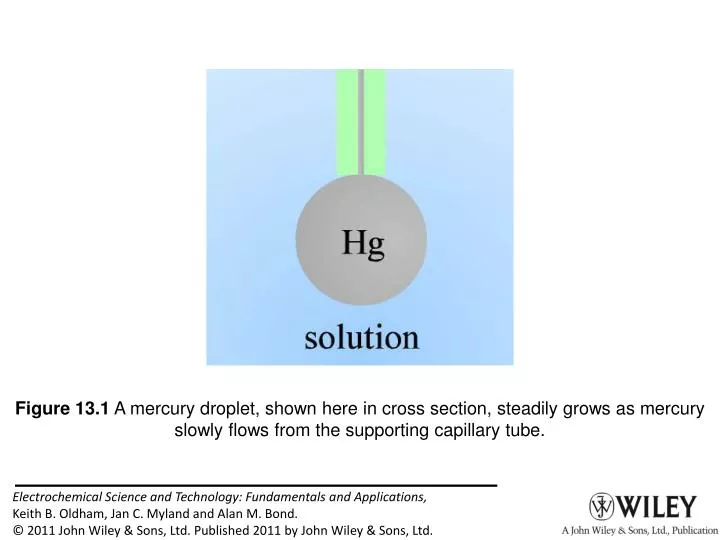
Figure 13.1 A mercury droplet, shown here in cross section, steadily grows as mercury slowly flows from the supporting capillary tube.
Figure 13.2 Simple electro-capillary curve at a mercury electrode. The simplicity of such a curve is often impaired by the presence of adsorbing species.
Figure 13.3 The relationship of capacitance to electrode potential according to three models of the double layer: those of Helmholtz, Gouy and Chapman, and Stern. The following parameters were adopted: T = Tº, c = 10 mM, xH = 0.2 nm, εH = 6 10–11F m–1, ε = 7 10–10 F m–1, A = 1 mm2, and Ezc = –230 mV versus SHE.
Figure 13.4 Cartoon of the supposed structure of the interfacial region of a double layer when the electronic conductor is charged negatively (left) or positively (right). Only a small portion of the diffuse zone is shown.
Figure 13.5 The potential, field, and charge density profiles according to the Stern model. A 10.0 mM aqueous solution of singly charged ions at 25.0ºC confronts an electronic conductor bearing a positive charge of density 10.0 mC m–2. A permittivity ofε = 78.54 ε0 is assumed, except εH = 10.0ε0 in the compact layer, which has a width of 0.400 nm.
Figure 13.6 Capacitance-versus-potential graphs, measured by a.c., for the Hg | 11000 mM KCl(aq) interface without and with 10 mM pentanol, revealing evidence of strong adsorption of the CH3(CH2)4OH molecules in the range –0.7 V < E < –0.1 V. At lower frequencies the sharp peaks become higher, while at high frequencies they disappear because the changing electric field outruns the adsorption/desorption speeds.
Figure 13.7 A linear potential-scan voltammogram for the oxidation of cytochrome-c peroxidase1326, a surface-confined reaction. The data relate to a monolayer coverage of the enzyme on a graphite electrode, scanned at a rate of 20 mV s–1 in a phosphate buffer. The figure represents only the faradaic portion of the voltammogram. The much larger non-faradaic current has been subtracted.
Figure 13.8 The current-voltage curve when a platinum electrode is subjected to a slow triangular potential perturbation over the range 0.0 V ≤ E(t) ≤ 1.5 V in sulfuric acid. The graph is illustrative only, because the detail depends on the scan rate, the acid concentration, the reversal potentials and particularly on the metallurgical and electrochemical pretreatment of the platinum.
Figure 13.9 A faradaic current badly contaminated by background.
Figure 13.10 Neither I, the current through the faradaic element, nor E–ERE, the voltage across it, is directly measurable. The potentiostat’s ammeter measures Imeas = I+Inf, while its voltmeter records the applied voltage ΔEappl = E –ERE–ImeasRu.
Figure 13.11 Variation of Gibbs energy with the size of the nucleus. Though this diagram actually describes the formation of a liquid from a supercooled vapor1348, the same principles apply to all metastable systems.
Figure 13.12 Adsorption of “extra” ions causes a field that is sensed by the nearby field-effect transistor.