Download
1 / 32
320 likes | 450 Views
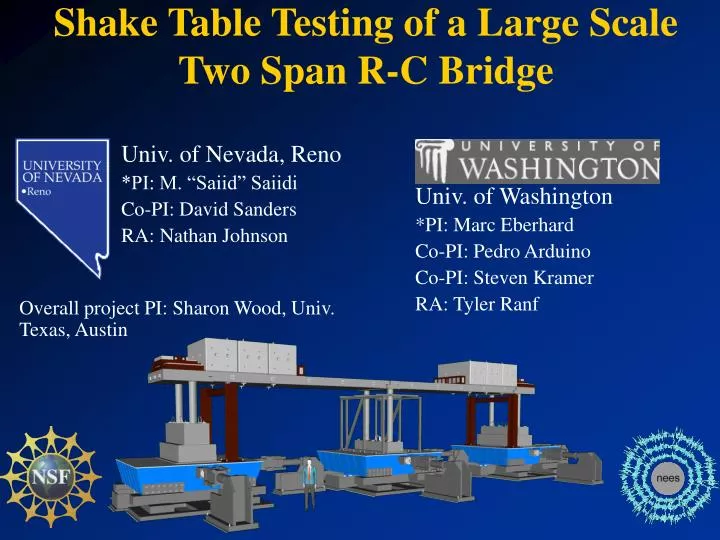
Shake Table Testing of a Large Scale Two Span R-C Bridge. Univ. of Nevada, Reno *PI: M. “Saiid” Saiidi Co-PI: David Sanders RA: Nathan Johnson. Univ. of Washington *PI: Marc Eberhard Co-PI: Pedro Arduino Co-PI: Steven Kramer RA: Tyler Ranf.

E N D
Shake Table Testing of a Large Scale Two Span R-C Bridge Univ. of Nevada, Reno *PI: M. “Saiid” Saiidi Co-PI: David Sanders RA: Nathan Johnson Univ. of Washington *PI: Marc Eberhard Co-PI: Pedro Arduino Co-PI: Steven Kramer RA: Tyler Ranf Overall project PI: Sharon Wood, Univ. Texas, Austin
Outline • Background information • Basics of the design • Construction and assembly • Instrumentation and test schedule • Experimental observations/results • Analytical modeling • Future work
Prototype Bridge Frame • Continuous CIP post-tensioned RC box girder. • 120 ft span lengths. • 4 ft circular columns, fixed-fixed. • Varied column heights. • Drilled shafts (pile extension as opposed to pile cap). • Axial load index = 0.08.
Shake Table Tests • 0.25 linear scale (12in dia. Columns) • Columns fixed at pile point of maximum curvature • Column heights of 5ft, 8ft & 6ft • Input motions: soil motion at pile immediately below plastic hinge • Concentrate on column response and interaction in global system
Basics of the Design • Columns: NCHRP 12-49 / Caltrans • Long. steel ratio = 1.56% • Lateral steel ratio = 0.86% • Joints not modeled in detail • Superstructure not modeled in detail • Convert prototype into equivalent specimen solid section
Inertial/Axial Masses • 46.5 kip required per column • Weight Scaled by length3, pressure only by length2 • Concrete Blocks = 120 kip • Lead = 58 kip
Superstructure Design • 2 sets - three 331in x 30in x 14in beams • Dapped ends • DL SF = 2 (ignore post-tensioning)
Post-Tensioning • Longitudinal System • Prevent cracking in superstructure • Transverse System • Maintain beam continuity (90in x 14in) • Clamping force to prevent beam separation caused by transverse lateral moment • Mass to deck • Footings to tables
A Construction B C D E F
Assembly • 11 pieces cast separately on and off-site • Grouted / Post tensioned together • Imposed mass added A B C D E F
Instrumentation • Column lat./long. strain gauges • Shear transducers • Curvature transducers • 298 channels @ 100Hz
Accelerometers • Transducers
Earthquake Motions • 1994 Northridge Century City • UC Davis and U. Washington • 90deg and 180deg components • Motion transmitted down to bedrock using Proshake (83ft) • Propagated up through medium-dense sand to 2D pile depth (equivalent depth of fixity) • Low amplitude testing (pre-yield) (14 tests) • Transverse incoherent motions • Biaxial motions • Centrifuge motions • High amplitude testing (to failure) (9 tests) • From 0.075g to 1.66g PGA
Transverse modes of bridge Translation (mode 2) 81.9% Rotation (mode 3) 18% Superstructure Bending (mode 6) 0.1%
Damage Progression 0.5g: Significant Flexural Cracks in B1 & B3 1.0g: Concrete Spalling and first lateral steel exposure in B1 & B3 1.33g: long bar exposure in B3
Damage Progression 1.66g (failure): four spirals fractured, 36 buckled long. bars 1.33g: First lateral steel exposure in B2
Acceleration-Disp. Hysteresis Tests 12-20 (cumulative) Bent 1 (6 ft columns) Bent 2 (8 ft columns) Bent 3 (5ft columns)
Data Processing • Structural data: displacement, acceleration, strain, curvature, shear • Shake table motions • Accelerations, displacements, spectra • Videos, photos • Correlation of force with acceleration • Extract force from shake tables for select runs
SAP 2000 Modeling(work in progress) • Expansion of model used for design / pre-analysis • Moment-rotation hinges Nonlinear fiber hinges • Model efficiency • Study the effect of fiber and element configurations • Model parameters • Material models • Input motions • Time-step / integration • Verification/calibration of model • Compare accelerations and displacements from shake table tests • Compare with Drain-3DX • Utilize model to focus on system response
Test 15 Displacement Predictions mD = 1.5~2.5
Test 18 Displacement Predictions mD = 4.1~5.5
Future Work • Complete calibration and verification of analytical model • Investigation of system response utilizing experimental data and analytical model • Expansions of computer model • More complete system • Earthquake loading including biaxial motions