Download
1 / 20
200 likes | 309 Views
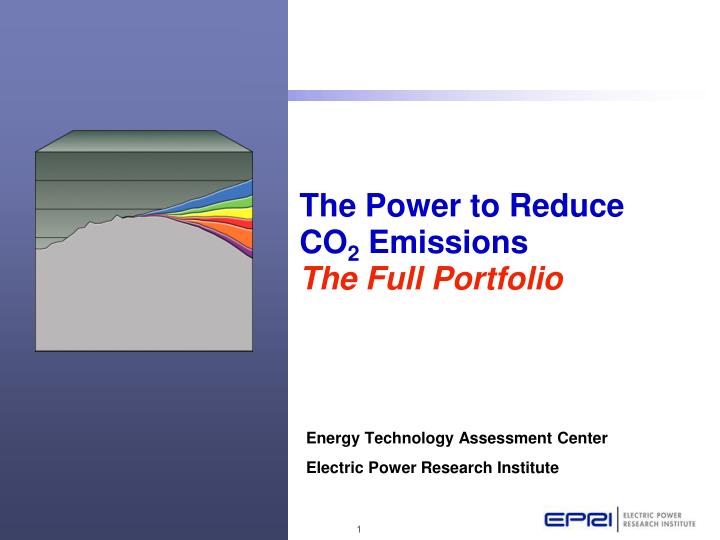
The Power to Reduce CO 2 Emissions The Full Portfolio. Energy Technology Assessment Center Electric Power Research Institute. Presentation Objective…Answer Three Questions. What is the technical potential for reducing U.S. electric sector CO 2 emissions?

E N D
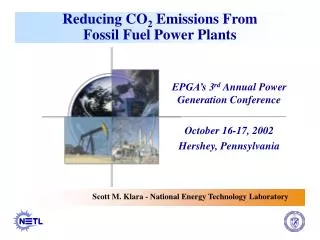
The Power to Reduce CO2 EmissionsThe Full Portfolio Energy Technology Assessment Center Electric Power Research Institute
Presentation Objective…Answer Three Questions • What is the technical potential for reducing U.S. electric sector CO2 emissions? • What are the economic impacts of different technology strategies for reducing U.S. electric sector CO2 emissions? • What are the key technology challenges for reducing electric sector CO2 emissions?
2008 Prism...Technical Potential for CO2 Reductions AEO2007*(Ref) Achieving all targets is very aggressive, but potentially feasible. AEO2008*(Early release) AEO2008*(Ref) Impact of efficiency measures in Energy Independence and Security Act of 2007 (EISA2007) *Energy Information Administration (EIA) Annual Energy Outlook (AEO)
Generation Mix 2007 U.S. Electricity Generation Mix Non-Hydro Renewables, 2% Conventional Hydropower, 7% EPRI “Prism” Projected 2030 Generation Mix Nuclear, 21% Non-Hydro Renewables, 9% Conventional Hydropower 5% Coal w/o CCS 39% Natural Gas, 18% Petroleum, 1% Coal, 51% EIA 2008 with Energy Bill – Projection for 2030 Coal, 58% Non-Hydro Renewables, 5% Conventional Hydropower, 6% Nuclear 29% Nuclear, 19% Natural Gas 5% Advanced Coal w/CCS, 13% Natural Gas, 11% Petroleum, 1%
The Scale of Electricity Demand • 2007 U.S. electricity consumption ~ 3800 TWh • NY metro area ~ 89 TWh/year (as of 2006) • EIA 2008 Annual Energy Outlook • Preliminary report projects 1150 TWh (30%) increase in U.S. electricity consumption by 2030. • ~Equivalent to addition of 13 New York metro areas • Greater than addition of new load equivalent to 2006 consumption of Texas, California, Florida, Ohio, Pennsylvania
The Scale of Electricity Demand • Scale of generation • One advanced light water nuclear plant (1400 MW, 90% CF) ~ 11 TWh • One coal plant (500 MW, 80% CF) ~ 3.5 TWh • One natural gas turbine (400 MW, 40% CF) ~ 1.4 TWh • One 100 MW Wind Farm (100 1 MW Turbines, 40% CF) ~ 0.35 TWh • Intensity of CO2 emissions • One coal plant (500 MW, 80% CF) ~ 3-4 MMT CO2/yr. • Depends on coal type, plant technology, heat rate • Natural gas emits at ~ ½ intensity of coal • LNG combustion can be ~50%-66% of CO2 intensity of coal, depending on source and supply chain.
Presentation Objective…Answer Three Questions • What is the technical potential for reducing U.S. electric sector CO2 emissions? • What are the economic impacts of different technology strategies for reducing U.S. electric sector CO2 emissions? • What are the key technology challenges for reducing electric sector CO2 emissions?
Representative U.S. Economy-Wide CO2 Constraint 9 Starting Point is Current Intensity Target • PRISM electric sector CO2 profile most closely modeled by economy-wide constraint which: • Caps emissions at 2010 levels until 2020 • Requires 3% decline beginning in 2020 • 37% of 2005 emissions levels by 2050 8 7 2010 Cap to 2020 6 5 Billion Tons CO2 per year 4 3% decline 3 2 1 0 2000 2010 2020 2030 2040 2050
Full Technology Portfolio Reduces Costs of a CO2 Emissions Reduction Policy by 60% 0.0 Cost of Policy Full Portfolio + PHEV Only Limited Portfolio + CCS Only + Nuclear Only + Renewables Only + Efficiency Only -0.5 Change in GDP Discounted Through 2050 ($Trillions) Reduction in Policy Cost with Advanced Technology $1 Trillion -1.0 -1.5 Value of R&D Investment
180 4.0 160 3.5 140 3.0 120 2.5 100 2.0 80 1.5 60 1.0 40 0.5 20 0 0.0 2000 2010 2020 2030 2040 2050 Wholesale Electricity Price In the Full Portfolio the price of electricity has a low CO2 cost component and increases less Limited Index Relative to Year 2000 $/MWh* Full Year *Real (inflation-adjusted) 2000$
With a less de-carbonized supply, electricity load must decline to meet the CO2 emissions target Gas (with half the CO2 of coal) pays a significant CO2 cost U.S. Electric Generation – Limited Portfolio Biomass Wind Hydro Nuclear Gas Coal
U.S. Electric Generation – Full Portfolio The vast majority of electricity supply is CO2-free Wind Hydro Gas and non-captured coal are the only supply options paying a CO2 cost Nuclear Gas Public Policy (e.g. RPS) can modify this economic allocation Coal with CCS Coal
Increase in Real Electricity Prices…2000 to 2050 +260% +45% Both Scenarios meet the same economy-wide CO2 Cap* *Economy-wide CO2 emissions capped at 2010 levels until 2020 and then reduced at 3%/yr
Presentation Objective…Answer Three Questions • What is the technical potential for reducing U.S. electric sector CO2 emissions? • What are the economic impacts of different technology strategies for reducing U.S. electric sector CO2 emissions? • What are the key technology challenges for reducing electric sector CO2 emissions?
Transition to Low-Emissions Technologies • Enabling Efficiency, PHEVs, DER via the Smart Distribution Grid • Enabling Intermittent Renewables via Advanced Transmission Grids • Expanded Advanced Light Water Reactor Deployment • Advanced Coal Plants with CO2 Capture and Storage
$1,000B $30B RD&D is a Good Investment Avoided Cost to U.S. Economy (2000-2050, present value in 2000 $) RD&D Investment (2005-2030, present value in 2000 $)
The Full Portfolio: Lower CO2, Lower Prices +260% +45% Conclusions • The potential to reduce emissions is there. • Development of a Full Portfolio of technologies substantially lowers the cost of reducing CO2 emissions and helps keep electricity affordable. • Key technology challenges must be overcome to launch the Full Portfolio of technologies. • Demonstration projects are essential to launching technology. *Economy-wide CO2 emissions capped at 2010 levels until 2020 and then reduced at 3%/yr