Download
1 / 20
200 likes | 327 Views
Break-Even A nalysis. Unit 5 Operations Management. Learning Objectives. Use graphical and quantitative methods to calculate the break even quantity, profit and margin of safety

E N D
Break-Even Analysis Unit 5 Operations Management
Learning Objectives • Use graphical and quantitative methods to calculate the break even quantity, profit and margin of safety • HL – Use these methods to analyse the effects of changes in price or cost on break even , profit and margin of safety • HL - Calculate the required output level for a given target revenue or profit • Analyse the assumptions and limitations of break even analysis
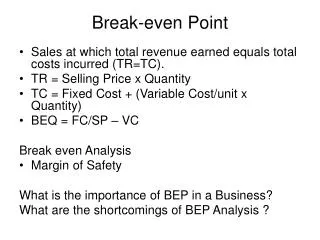
Break Even Point • The level of output at which total costs equal total revenue
Break Even Total Costs = Total Revenue No profit or loss is made
Calculating break even • Can be done in 3 ways • Table of costs and revenues method • Graphical method • Formula method
Hamburger Stall Stall has to pay $500 for each match day (fixed costs) Hamburger costs $1 (variable costs) Sold for $2 What is the break even? 1. The Table Method
2. The Graphical Method – The Break Even Chart • Common to appear on exams (especially SL)
2. The Graphical Method – The Break Even Chart • Break even chart requires a graph with these axes Costs and sales revenue ($) 0 Units of output
2. The Graphical Method – The Break Even Chart • The chart itself is drawn showing 3 pieces of information • Fixed costs • Total costs • Sales revenue
Break even chart – points to note • Fixed cost line is horizontal showing that fixed costs are constant at all output levels • Variable cost starts at 0 and increases at a constant rate • Total cost line begins at the level of fixed costs but then follows the slope / gradient as variable costs • Sales revenue starts at 0, increases at a constant rate • The point at which total cost and sales revenue line cross is the break even point, below this losses are being made and above profits are being made Can you plot create a break even chart without even seeing one first?
Costs and sales revenue Sales 0 Full Capacity Units of output
Margin of SafetyThe amount by which the sales level exceeds the break even level of output
Margin of safety Actual Sales – Break Even Output • Useful indication of how much sales could fall without the firm falling into a loss
Costs and sales revenue Sales Margin of safety 0 Full Capacity Units of output
3. The Break Even Formula Method If fixed costs are $200,000 and the contribution per unit of output is $50, then the break even level of production is…. Exact answer therefore likely to be more accurate than many break even graphs 200000 = 50
Read the case study thoroughly!!! They don’t just give you the figures you may need to do some basic maths first