Download
1 / 17
170 likes | 174 Views
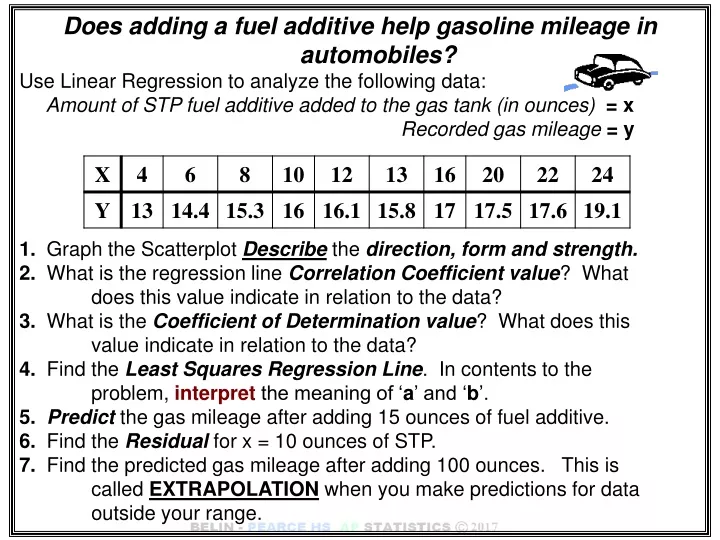
Does adding a fuel additive help gasoline mileage in automobiles? Use Linear Regression to analyze the following data: Amount of STP fuel additive added to the gas tank (in ounces) = x Recorded gas mileage = y 1. Graph the Scatterplot Describe the direction, form and strength.

E N D
Does adding a fuel additive help gasoline mileage in automobiles? Use Linear Regression to analyze the following data: Amount of STP fuel additive added to the gas tank (in ounces)= xRecorded gas mileage = y 1. Graph the Scatterplot Describe the direction, form and strength. 2. What is the regression line Correlation Coefficient value? What does this value indicate in relation to the data? 3. What is the Coefficient of Determination value? What does this value indicate in relation to the data? 4. Find the Least Squares Regression Line. In contents to the problem, interpret the meaning of ‘a’ and ‘b’. 5. Predict the gas mileage after adding 15 ounces of fuel additive. 6. Find the Residual for x = 10 ounces of STP. 7. Find the predicted gas mileage after adding 100 ounces. This is called EXTRAPOLATION when you make predictions for data outside your range.
1. Graph the Scatterplot Describe the direction, form and strength. 2. What is the regression line Correlation Coefficient value? What does this value indicate in relation to the data? 3. What is the Coefficient of Determination value? What does this value indicate in relation to the data? 4. Find the Least Squares Regression Line. In contexts to the problem, interpret the meaning of ‘a’ and ‘b’. • Predict the gas mile after adding 15 ounces of fuel additive. 6. Find the Residual for x = 10 ounces of STP. 7. Find the predicted gas mileage after adding 100 ounces. This is called EXTRAPOLATION when you make predictions for data outside your range.
Finding the Least Squares Regression Model from summary statistics :
Here are the summary statistics for the number of hurricanes that have formed per year over the past 100 years and for Temperature of the ocean each year for the same time period. We would like to use ocean temperature to predict number of hurricanes. a.) Find the Least squares regression line AND interpret a and b in contexts to the problem..
The following Regression analysis indicates the association between the number of Hours you spend preparing for a test and the Gradeyou obtain... Regression Analysis Variable Coef StDev T P Constant 10.561 2.948 3.582 0.000 Hours 9.0756 1.2373 7.335 0.000 S = 2.196 R-Sq = 96.7% R-Sq(adj) = 98.1% a= b= • Find the Least Square Regression Line and interpret slope and y-intercept. 2. Find and interpret the Correlation. Very Strong, Negative, Linear Association
Is there a relationship between the money a Baseball team spends and the number of wins they experience that season. A linear regression was performed on the average salary (in millions of dollars) and the number of games won: • Find the Actual number of wins of a team that spent an average of 5 millions dollars in salary.
Find the Actual number of wins of a team that spent an average of 5 millions dollars in salary.
WARM-UP Is there an association between how much a baseball team pays its players (Average in millions) and the team winning percentage? Find AND interpret r and R2 . Team Average Win PCT N.Y. Yankees 4.34 64.0 Boston 3.61 57.4 Texas 3.63 44.4 Arizona 3.11 60.5 Los Angeles 3.64 56.8 New York Mets 3.63 46.6 Atlanta 3.01 63.1 Seattle 3.21 57.4 Cleveland 2.63 45.7 San Francisco 2.89 59.0 Toronto 2.65 48.1 Chicago Cubs 2.70 41.4 St. Louis 2.84 59.9 Examine Graph ŷ = 38.953 + 4.725x r = 0.31 R2 = 9.8%
x y y Residual Team Average Win PCT N.Y. Yankees 4.34 64.0 Boston 3.61 57.4 Texas 3.63 44.4 Arizona 3.11 60.5 Los Angeles 3.64 56.8 New York Mets 3.63 46.6 Atlanta 3.01 63.1 Seattle 3.21 57.4 Cleveland 2.63 45.7 San Francisco 2.89 59.0 Toronto 2.65 48.1 Chicago Cubs 2.70 41.4 St. Louis 2.84 59.9 59.46 56.01 56.10 53.65 56.15 56.10 53.17 54.12 51.38 52.61 51.47 51.71 52.37 4.54 1.39 -11.70 6.85 0.65 -9.50 9.93 3.28 -5.68 6.39 -3.37 -10.31 7.53
Warm-Up Temperature 90 88 101 87 75 98 72 86 99 74 92 # of Sales: 182 42 240 128 101 220 94 132 201 93 145 Does temperature effect ice cream sales. A local ice cream shop sold the following amounts on various days: 1. Construct and Describe the Form and Direction of the Scatterplot. • Identify any Outliers. • Find and Interpret the correlation.
WARM - UP Many Blogs are declaring that the Government is manipulating Gas Reserves therefore manipulating Gas Prices. To investigate this analyze the following.