Download
1 / 8
80 likes | 93 Views
This lecture covers the assumptions, properties, and interpretation of multivariate linear regression (MLR) in econometrics, with a focus on estimating economic relationships and testing theories. The lecture also discusses the steps of econometrics research and the use of cross-sectional, time series, and panel data. Additionally, it explores the concepts of ceteris paribus, causal effects, obtaining OLS estimates, and interpreting the OLS estimates. The lecture concludes with an overview of the assumptions of the OLS model and the Gauss-Markov assumptions.

E N D
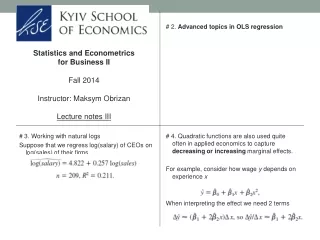
Statistics and Econometrics for Business II Fall 2014 Instructor: MaksymObrizan Lecture notes I # 2. Multivariate Linear Regression (MLR): assumptions, properties and interpretation Lecture notes are based on Introductory Econometrics by Jeffrey Wooldridge Required readings: Chapter 3 (pp 68-101) # 3. What is econometrics? Quote from Wooldridge: “Econometrics is based upon the development of statistical methods for estimating economic relationships, testing economic theories, and evaluating and implementing government and business policy.” Model 1: What are potential determinants of the wage? # 4. A complete econometric model might look like
# 5. Estimating returns to inputs of production in macroeconomic context # 6. Why not mathematical statistics? Econometrics is different from mathematical statistics due to nonexperimental nature of the economic data # 7. Steps of the econometrics research Economists use empirical analysis to test their hypotheses and quantify economic relationships # 8. Steps of the econometrics research II
# 9. Data for econometrics Quote from Wooldridge: “A cross-sectional data set consists of a sample of individuals, households, firms, cities, states, countries, or a variety of other units, taken at a given point in time.” Time series data tracks variables over time (stock prices, money supply, consumer price index, gross domestic product) # 10. Pooled and panel data Panel data (or longitudinal data) consist of a time series for each member in the data set. # 11. Ceteris paribus Quote from Wooldridge: “In most tests of economic theory, and certainly for evaluating public policy, the economist’s goal is to infer that one variable (such as education) has a causal effect on another variable (such as worker productivity). … The notion of ceteris paribus—which means “other (relevant) factors being equal” plays an important role in causal analysis.” # 12. Causal effects In order to prove causal effects one can run experiment In economics it is often impossible (too costly, unethical etc)
# 13. The general multiple linear regression model (sometimes called the multiple regression model) is written in the population as # 14. Quote from Wooldridge: “No matter how many explanatory variables we include in our model, there will always be factors we cannot include, and these are collectively contained in u.” # 15. Obtaining the OLS Estimates Quote from Wooldridge: “We first consider estimating the model with two independent variables. The estimated OLS equation is written in a form similar to the simple regression case: # 16. How do we obtain the estimated coefficients? Quote from Wooldridge: “The method of ordinary least squares chooses the estimates to minimize the sum of squared residuals.”
# 17. Interpreting the OLS estimates # 18. Quote from Wooldridge: “Using the 526 observations on workers in WAGE1.RAW, we include educ (years of education), exper (years of labor market experience), and tenure (years with the current employer) in an equation explaining log(wage).” The estimated equation is then # 19. Fitted values Suppose that one person in the sample has educ 12, exper 7 and tenure of 2 years Question: What is the predicted log(wage) for this person? One can also predict wages for people out of sample # 20. We can define the residual for observation i as Observe that the actual log(wage) for that person is 1.67 Thus, the residual for this person is 0.21 and we have underpredicted wage for her
# 21. Some properties of the OLS residuals 1. The sample average of the residuals is zero 2. The sample covariance between each independent variable and the OLS residuals is zero # 22. Goodness-of-Fit R-squared is one of the most common measures R-squared is interpreted as the proportion of the sample variation in log(wage) that is explained by the OLS regression line # 23. R-squared usually increases when another independent variable is added to a regression # 24. Assumptions of the OLS model Assumption MLR.1 OLS is linear in parameters Still, OLS is quite flexible because one can use arbitrary functions of the underlying variables of interest (natural logarithms, squares etc)
# 25. Assumption MLR.2 We have a random sample of n observations from the population model Assumption MLR.3 There are no exact linear relationships among the independent variables (no perfect collinearity) # 26. Assumption MLR.4 The residual u has an expected value of zero given any values of the independent variables # 27. Under assumptions MLR.1-MLR.4 the OLS estimators are unbiased estimators of the population parameters # 28. Variance Unbiasedness is the property of central tendency (i.e. mean) We also want to know about spread (i.e. variance) of the estimate
# 29. Assumption MLR.5 The residual u has the same variance given any values of the explanatory variables. In our simple equation # 30. Assumptions MLR.1 - MLR.5 are referred to as the Gauss-Markov assumptions (for cross-sectional regression). There may be many unbiased estimators satisfying assumptions MLR.1 through MLR.4 However, if we also add assumption MLR.5 then OLS is best linear unbiased estimator (BLUE) – Gauss-Markov theorem # 31. What does best estimator mean? Wooldridge: “best is defined as having the smallest variance” Question: If you have two unbiased estimators with different variances which one will you choose? # 32. Notes