Download
1 / 1
10 likes | 123 Views
Where to locate Burrito MaMa ?. Dylan Crary & Christina Cheng Geography C188, University of California, Berkeley. Method I

E N D
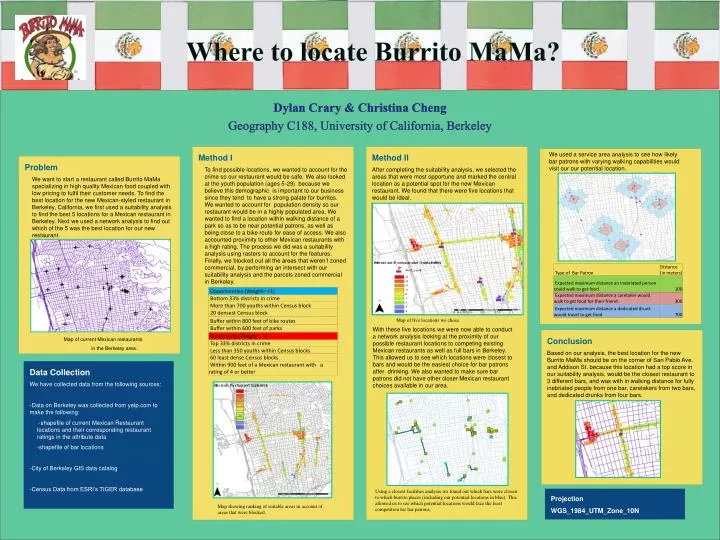
Where to locate Burrito MaMa? Dylan Crary & Christina Cheng Geography C188, University of California, Berkeley Method I To find possible locations, we wanted to account for the crime so our restaurant would be safe. We also looked at the youth population (ages 5-29) because we believe this demographic is important to our business since they tend to have a strong palate for burritos. We wanted to account for population density so our restaurant would be in a highly populated area. We wanted to find a location within walking distance of a park so as to be near potential patrons, as well as being close to a bike route for ease of access. We also accounted proximity to other Mexican restaurants with a high rating. The process we did was a suitability analysis using rasters to account for the features. Finally, we blocked out all the areas that weren’t zoned commercial, by performing an intersect with our suitability analysis and the parcels zoned commercial in Berkeley. Method II After completing the suitability analysis, we selected the areas that were most opportune and marked the central location as a potential spot for the new Mexican restaurant. We found that there were five locations that would be ideal. We used a service area analysis to see how likelybar patrons with varying walking capabilities would visit our our potential location. • Problem • We want to start a restaurant called Burrito MaMaspecializing in high quality Mexican food coupled with low pricing to fulfil their customer needs. To find the best location for the new Mexican-styled restaurant in Berkeley, California, we first used a suitability analysis to find the best 5 locations for a Mexican restaurant in Berkeley. Next we used a network analysis to find out which of the 5 was the best location for our new restaurant. • Map of current Mexican restaurants • in the Berkeley area. Map of five locations we chose. With these five locations we were now able to conduct a network analysis looking at the proximity of our possible restaurant locations to competing existing Mexican restaurants as well asfull bars in Berkeley. This allowed us to see which locations were closest to bars and would be the easiest choice for bar patrons after drinking. We also wanted to make sure bar patrons did not have other closer Mexican restaurant choices available in our area. Conclusion Based on our analysis, the best location for the new Burrito MaMa should be on the corner of San Pablo Ave. and Addison St. because this location had a top score in our suitability analysis, would be the closest restaurant to 3 different bars, and was with in walking distance for fully inebriated people from one bar, caretakers from two bars, and dedicated drunks from four bars. • Data Collection • We have collected data from the following sources: • -Data on Berkeley was collected from yelp.com to make the following: • -shapefile of current Mexican Restaurant locations and their corresponding restaurant ratings in the attribute data • -shapefile of bar locations • City of Berkeley GIS data catalog • -Census Data from ESRI’s TIGER database Using a closest facilities analysis we found out which bars were closest to which burrito places (including our potential locations in blue). This allowed us to see which potential locations would face the least competition for bar patrons. Projection WGS_1984_UTM_Zone_10N Map showing ranking of suitable areas in account of areas that were blocked.