Download
1 / 26
260 likes | 347 Views
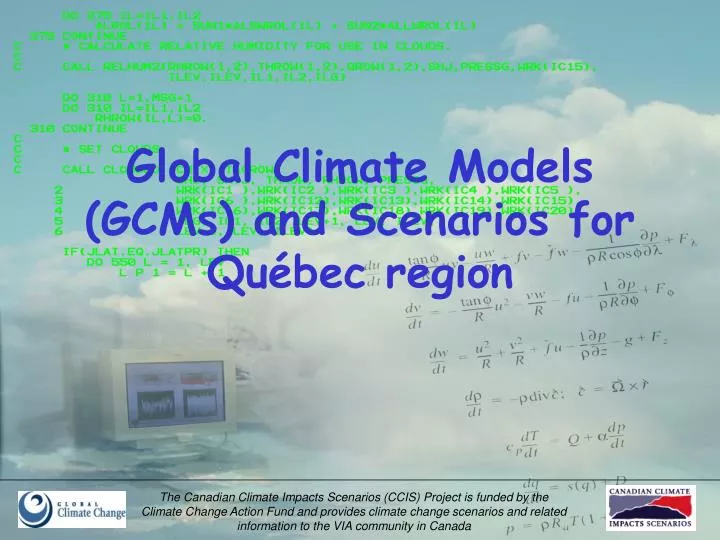
Global Climate Models (GCMs) and Scenarios for Québec region. Climate Processes. [Source: Harvey (2000): Global Warming: The Hard Science ]. GCM Characteristics. GFDL-R15 (7.5° x 4.4°; 500 x 600km). CCSR/NIES (5.625° x 5.625°). CSIROMk2b (5.625° x 3.25°). Increasing resolution.

E N D
Global Climate Models (GCMs) and Scenarios for Québec region
Climate Processes [Source: Harvey (2000): Global Warming: The Hard Science]
GCM Characteristics GFDL-R15 (7.5° x 4.4°; 500 x 600km) CCSR/NIES (5.625° x 5.625°) CSIROMk2b (5.625° x 3.25°) Increasing resolution CGCM1 & 2 (3.75° x 3.75°) HadCM2 & 3 (3.75° x 2.5°) GFDL-R30 (3.75° x 2.24°) ECHAM4 & NCAR-PCM (2.8125° x 2.8125°; 300 x 300 km)
How well do GCMs perform? • MIP: Model intercomparison projects • AMIP: Atmospheric model • CMIP: Coupled model • PMIP - mid-Holocene (approx. 6000 BP); Last Glacial Maximum (20,000 BP)
Temperature in °C Model mean =all Flux & non-flux corrected results (vs NCAR dataset) [Source: IPCC TAR, 2001, chap. 8]
Precipitation in mm/day (vs Xie-Arkin dataset, 1997) [Source: IPCC TAR, 2001, chap. 8]
Detection and Attribution Natural Forcing Only [Source: IPCC TAR]
Detection and Attribution Anthropogenic Forcing Only [Source: IPCC TAR]
Detection and Attribution All Forcings [Source: IPCC TAR]
IPCC TAR Conclusions • GCMs provide credible simulations of both annual mean climate and the climatological seasonal cycle over broad continental scales. Clouds and humidity remain sources of significant uncertainty, but improvements in simulations of these have been made (e.g. Walsh et al., 2002; Lambert et Boer, 2001). • Analysis of, and confidence in, extreme events simulated within climate models is emerging, particularly for storm tracks and storm frequency (e.g. Lambert et al., 2002). • Performance in simulating ENSO and NAO has improved.
Difference between the model mean simulated cyclone events and the number of cyclone events from the ECMWF/ERA analyses Simulated mean sea level pressure field averaged over the thirteen AMIP1 models for DJF in mb (contoured) and its departure from the ECMWF/ERA analyses in mb (shaded) AMIP results, Source (Lambert et al., 2002)
2xCO2 Global-mean temperature (°C) DT 1xCO2 Time (10 years) GCM evolution EQUILIBRIUM EXPERIMENTS (1980s)
(°C) Global-mean temperature GCM Evolution TRANSIENT EXPERIMENTS Climate change integration COLD START (late 1980s) t2 t1 WARM START (early 1990s)
A1FI - HadCM3, CCSR/NIES A1T - CCSR/NIES A1 - CCSR/NIES, CSIROMk2b CGCM2 HadCM3 ECHAM4 CSIROMk2b CCSR/NIES GFDL-R30 NCAR-PCM HadCM3 CSIROMk2b CCSR/NIES
SRES A2: Winter 2050s Temperature Change (°C)
Temperature Change (°C) SRES A2: Summer 2050s
Precipitation Change (%) SRES A2: Winter 2050s
Precipitation Change (%) SRES A2: Summer 2050s
Precipitation Change (%) SRES B2: Summer 2050s
Spatial Scale Issues (Hudson Bay) No representation of Hudson Bay
Spatial Scale Issues from GCM to RCM GCM (350 km) CRCM (15 km)