Download

1 / 14
160 likes | 286 Views
2013 Load Impact Evaluation of CAISO Flex Alert Program. Steve Braithwait, Dan Hansen, and Marlies Hilbrink Christensen Associates Energy Consulting DRMEC Spring Workshop May 7, 2014. Outline. Features of Flex Alert program Analysis methods Ex-post load impacts ( 2013).

E N D
2013 Load Impact Evaluation of CAISO Flex Alert Program Steve Braithwait, Dan Hansen, and Marlies Hilbrink Christensen Associates Energy Consulting DRMEC Spring Workshop May 7, 2014
Outline • Features of Flex Alert program • Analysis methods • Ex-post load impacts (2013)
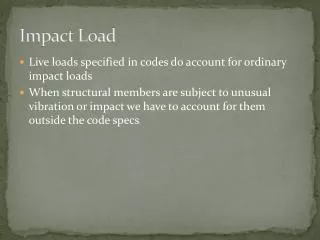
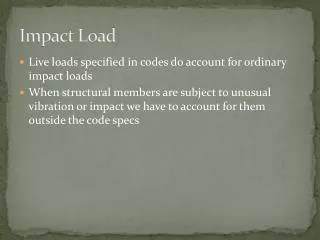
CAISO Flex Alert Program • Program features • Called for conditions of very low operating reserves or transmission emergencies • Requests for all consumers to voluntarily reduce energy use during afternoon hours • Alerts in 2013 • July 1 and 2 in Northern California • April 16 for San Jose area only (vandalism at substation)
Overview of Analysis Approach • Key factors/issues • Nearly all PG&E DR programs called on July 1 & 2 • Only system-level data available for April local event • Bulk of media expenditures focused on Southern CA; greater familiarity with “Flex Alert” there • Regression analysis of PG&E hourly system load data (also residential DLP data) • Accounted for impacts of PG&E DR programs by adding LI estimates back into system load
Load Impact Estimation Approach • Flex Alert LI = Ref. Load – Adj. Observed Load • Adjusted Observed Load = Observed system load + DR load impacts (post-event estimates) • Reference Load represents an estimate of what the adjusted observed system load would have been with no Flex Alert • Usual regression equation applied to hourly Adj. Obs. Load data, with variables for hours, day-types, weather, and Flex Alert events
Estimated Flex Alert Load Impact Coefficients(Negative values are reductions) +/- Standard Error
Summary of Findings • No statistically significant usage reductions could be attributed to the July Flex Alerts • I.e., none of the estimated hourly load impacts can be judged to be significantly different from zero, given the uncertainty around the estimates • Uncertainty due to natural variation in system load due to weather, customers’ operational changes, etc. • Estimated usage changes for April event were positive, presumably due to factors that could not be accounted for fully in the analysis (including availability of only system-level data)
Questions? • Contact – Steve Braithwait or Dan Hansen, Christensen Associates Energy ConsultingMadison, Wisconsin • Steve@CAEnergy.com • Danh@CAEnergy.com • 608-231-2266