Download
1 / 21
210 likes | 314 Views
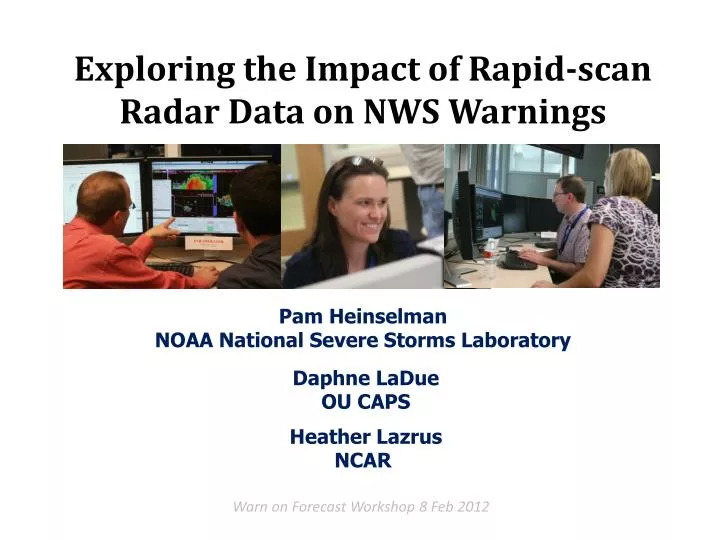
Exploring the Impact of Rapid-scan Radar Data on NWS Warnings. Pam Heinselman NOAA National Severe Storms Laboratory . Daphne LaDue OU CAPS. Heather Lazrus NCAR. Warn on Forecast Workshop 8 Feb 2012. Motivation. Stakeholders’ needs: Faster Updates. 62%.

E N D
Exploring the Impact of Rapid-scan Radar Data on NWS Warnings Pam HeinselmanNOAA National Severe Storms Laboratory Daphne LaDue OU CAPS Heather LazrusNCAR Warn on Forecast Workshop 8 Feb 2012
Motivation Stakeholders’ needs:Faster Updates 62% Source: Radar Operations Center
Motivation “To enhance the ability to monitor rapid tornadogenesis, the NWS should develop and implement additional Volume Coverage Pattern strategies that allow for more continuous sampling near the surface(e.g., 1-min lowest elevation sampling).”
MotivationBenefit Assessment JDOP(Burgess et al. 1979; Whiton et al. 1998)Performance improvement resulting from adding Doppler capability JPOLE (Scharfenberg et al. 2005)Case examples illustrating how polarization aided operations Understanding of storm severity, warning decisions, wording in follow-up statements, confidence
Objective Explore how improvements in depiction of storm development from rapid sampling may benefit forecasters’ decision making process.
Background: NWS Decision Making Andra et al. (2002)Description of 5 warning decision factors exemplified during 3 May 1999 tornado outbreak 1. Scientifically based conceptual models2. Two primary data sets: Doppler radar & ground truth3. Workstations and software4. Strategy5. Expertise
Background: NWS Decision making Morss and Ralph (2007)Participant observation & structured interviews during PACJET and CALJET Assessed operational benefit of forecaster use of off-shore, gap-filling observations provided during CALJET Use of additional data appeared to help forecasters-- In some cases, data improved specificity of forecast -- When initial forecast was fairly accurate, use of data increased forecaster confidence
12 forecasters, 12-30 April 2010 Tuesday AfternoonIntroduction to PAR & WDSS-II training Tuesday Evening and WednesdayGain experience interrogating PAR data and issue warnings usingWDSS-lI WARNGEN Thursday Temporal Resolution Experiment
Temporal Resolution Experiment Paired forecasters w/ similar radar analysis skills Worked tropical supercell event that produced EF1 tornado (unwarned ) Pair 1: 43-s updatesPair 2: 4.5-min updates
19 Aug 2007 43-sUpdates 4.5-min Updates
Data We Collected What they did Audio of the teams working through situation awareness and the case Video of computer screens Products issued What we saw Two observers took notes in each room
Data We Collected What they thought they did Teams debriefed individually Joint debrief to compare across teams Each individual completed a confidence continuum Each individual ranked factors in their warning decision
Understanding decision process Coding and Thematic Analysis Cognitive Actions Emotions Data used Experiment Design & Software
Example Analysis: 43-s Team Decision Process Video=28:01 – 28:10 Video=24:28 -- 25:41 Interrogate base velocity of north storm: “We’ve got that persistent meso. I’ve got 34 kts inbound now on this, 25 outbound” Interrogate base velocity & detect mesos in both storms; vel in south storm stronger aloft (50kts@15Kft) Video=22:29 – 22:53 Interrogate SRM to “make sure there is nothing as pertinent as far as rotation there” before issuing SVS on south storm’s warning; identify circ on south storm w/ strong inbound but weak outbound velocity Video=29:07 – 29:17 Interrogate base vel“usually at 35 kts you need to start considering tor.” Video=24:09 -- 24:27 Notices increase in reflectivity magnitude in north storm (0.5) Video=22:54 - 23:04 Examine shape of reflectivity Video=29:23 – 29:44 Video=25:52 – 27:58 Video=28:11 – 29:06 Compares location of vel couplet w/ location of refl. notch Interrogate top height and vertical reflectivity structure of both storms Video=29:45 -30:19 Interrogate reflectivity for notch signature Interrogates updated SRM and finds “41 inbound, 64 out…I don’t think I can ignore that.” 01:42:53 01:44:19 01:41:17 01:40:01 01:37:09 01:38:35 01:40:44 01:42:10 01:43:36 01:45:02 Video=23:05–24:08 Video=30:12 Issue SVS No changes are made to the warning Video=29:45 -30:19 At end statates, “41 inbound, 64 out…I don’t think I can ignore that.” PAR ~01:47:28 Issue TOR Warning 01:45:45 01:47:11 01:45:02 01:46:28 Video=30:12 Opens WarnGen at Video = 30:26 Issue Warning at Video = 32:38
EF1 TORN. Storm 43-s Team Warnings Positive Lead Time Negative Lead Time Comparison A +18.6 min 01:56:13 01:31:24 01:22:05 01:13:29 01:17:47 01:27:06 01:35:43 01:40:01 01:44:19 01:50:03 +6 min TOR N. Storm Comparison B -3.2 min 01:56:13 01:13:29 01:17:47 01:22:05 01:27:06 01:31:24 01:35:43 01:40:01 01:44:19 01:50:03 TOR N. Storm SVR S. Storm SVR N. Storm Comparison C +11.5 min 01:56:13 01:22:05 01:13:29 01:17:47 01:27:06 01:35:43 01:40:01 01:44:19 01:50:03 01:31:24 TOR N. Storm TOR S. Storm 0.5° LLSD Azimuthal Shear (s-1) Time (UTC)
EF1 TORN. Storm 4.5-min Team Warnings Positive Lead Time Negative Lead Time Comparison A 01:44:19 -0.7 min 01:56:13 01:31:24 01:22:05 01:13:29 01:17:47 01:27:06 01:35:43 01:40:01 01:50:03 TOR N. Storm Comparison B +4.6min 01:56:13 01:35:43 01:13:29 01:17:47 01:22:05 01:27:06 01:31:24 01:40:01 01:44:19 01:50:03 -1.6 min TOR N. Storm Comparison C 01:56:13 01:13:29 01:17:47 01:22:05 01:27:06 01:31:24 01:35:43 01:40:01 01:44:19 01:50:03 TOR N. Storm 0.5° LLSD Azimuthal Shear (s-1) Time (UTC)
What we’ve learned 6 teams interrogated similar radar signatures Came to different conclusions about whether and when to warn Decision(Confounding) Factors (Hahn et al. 2003; Hoffman et al. 2006; Pliske et al. 1997)
Understanding of Supercellin Tropical Environment C C C C B B B B A A A A Usual Confidence Less Confident More Confident Understanding of NWRT PAR Data C C C C B B B B A A A A Usual Confidence Less Confident More Confident
What we’ve learned • Data analysis was time intensive; exploring other methods • Warning decision process is complex • Some decision factors were similar across groups, others were not • Update time likely had a positive impact on warning lead time Warning Lead Times *43-s Teams 18.6 min 6min 11.5 min 0 min 20 min 4.6 min 4.5-min Teams *Issued 50% more warnings: 3 hits, 1 miss, 2 false alarms