1 / 34

Figure 7.1 The size range of cells

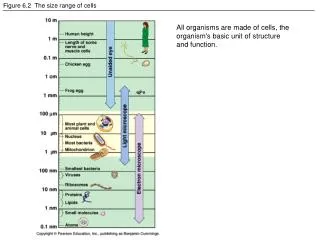
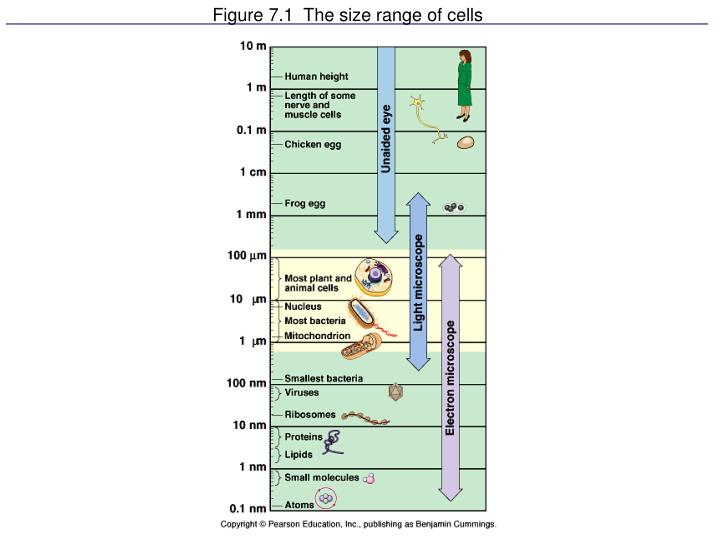
Figure 7.1 The size range of cells. Table 7.1 Different Types of Light Microscopy: A Comparison. Figure 7.3 Cell fractionation. Figure 7.4 A prokaryotic cell. Figure 7.4x2 E. coli. Figure 7.5 Geometric relationships explain why most cells are microscopic.

loring
Download Presentation

Figure 7.1 The size range of cells

An Image/Link below is provided (as is) to download presentation Download Policy: Content on the Website is provided to you AS IS for your information and personal use and may not be sold / licensed / shared on other websites without getting consent from its author. Content is provided to you AS IS for your information and personal use only. Download presentation by click this link. While downloading, if for some reason you are not able to download a presentation, the publisher may have deleted the file from their server. During download, if you can't get a presentation, the file might be deleted by the publisher.

E N D

Presentation Transcript


  1. Figure 7.1 The size range of cells

  2. Table 7.1 Different Types of Light Microscopy: A Comparison

  3. Figure 7.3 Cell fractionation

  4. Figure 7.4 A prokaryotic cell

  5. Figure 7.4x2 E. coli

  6. Figure 7.5 Geometric relationships explain why most cells are microscopic

  7. Figure 7.7 Overview of an animal cell

  8. Figure 7.8 Overview of a plant cell

  9. Figure 7.9 The nucleus and its envelope 

  10. Figure 7.10 Ribosomes

  11. Ribosomes • Small and large subunits have complex shapes. • Components different in prokaryotes and eukaryotes.

  12. The site of protein synthesis

  13. Figure 7.11 Endoplasmic reticulum (ER)

  14. Figure 7.12 The Golgi apparatus

  15. Figure 7.13 Lysosomes

  16. Figure 7.14 The formation and functions of lysosomes (Layer 3)

  17. Figure 7.15 The plant cell vacuole 

  18. Figure 7.16 Review: relationships among organelles of the endomembrane system 

  19. Figure 7.17 The mitochondrion, site of cellular respiration

  20. Figure 7.18 The chloroplast, site of photosynthesis

  21. Figure 7.19 Peroxisomes

  22. Figure 7.20 The cytoskeleton

  23. Figure 7.21 Motor molecules and the cytoskeleton

  24. Table 7.2 The structure and function of the cytoskeleton

  25. Figure 7.22 Centrosome containing a pair of centrioles

  26. Figure 7.23 A comparison of the beating of flagella and cilia

  27. Figure 7.24 Ultrastructure of a eukaryotic flagellum or cilium

  28. Figure 7.25 How dynein “walking” moves cilia and flagella

  29. Figure 7.26 A structural role of microfilaments

  30. Figure 7.27 Microfilaments and motility

  31. Figure 7.28 Plant cell walls

  32. Figure 7.29 Extracellular matrix (ECM) of an animal cell

  33. Figure 7.30 Intercellular junctions in animal tissues

More Related