Download
1 / 44
440 likes | 833 Views
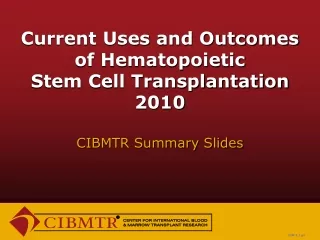
Current Uses and Outcomes of Hematopoietic Stem Cell Transplantation 2012. Summary Slides. SUM12_1.ppt. Location of Centers Participating in the CIBMTR 2012. Slide 2. SUM12_22.ppt. Transplant Activity in the U.S. 1980-2011. Transplants. Slide 3. SUM12_23.ppt.

E N D
Current Uses and Outcomes of Hematopoietic Stem Cell Transplantation2012 Summary Slides SUM12_1.ppt
Location of Centers Participating in the CIBMTR2012 Slide 2 SUM12_22.ppt
Transplant Activity in the U.S.1980-2011 Transplants Slide 3 SUM12_23.ppt
Allogeneic Stem Cell Sourcesby Recipient Age2001-2010 Transplants, % Age £ 20 yrs Age > 20 yrs Slide 4 SUM12_24.ppt
Autologous Stem Cell Sourcesby Recipient Age, 2001-2010 Transplants, % Age £ 20 yrs Age > 20 yrs Slide 5 SUM12_25.ppt
Trends in Transplantsby Type and Recipient Age*2001-2010 Transplants, % Allogeneic TransplantsAutologous Transplants * Transplants for AML, ALL, NHL, Hodgkin Disease, Multiple Myeloma Slide 6 SUM12_26.ppt
Trends in Transplantsby Transplant Type and Recipient Age*1990-2010 Transplants, % Allogeneic TransplantsAutologous Transplants * Transplants for AML, ALL, NHL, Hodgkin Disease, Multiple Myeloma Slide 7 SUM12_27.ppt
Indications for Hematopoietic Stem Cell Transplants in the United States, 2010(Inflation factor: Auto=1.25 (80%), Allo=1.05 (95%), All Transplants) Number of Transplants Slide 8 SUM12_28.ppt
Indications for Hematopoietic Stem Cell Transplants for Age £ 20yrs, in the U.S., 2010(Inflation factor: Auto=1.25 (80%), Allo=1.05 (95%), All Transplants) Number of Transplants Slide 9 SUM12_29.ppt
Allogeneic Transplants for Age £ 20yrs,Registered with the CIBMTR, 1993-2010- by Donor Type and Graft Source - Number of Transplants Slide 10 SUM12_30.ppt
Allogeneic Transplants for Age > 20yrs,Registered with the CIBMTR, 1993-2010- by Donor Type and Graft Source - Number of Transplants Slide 11 SUM12_31.ppt
Unrelated Donor Stem Cell Sourcesby Recipient Age2001-2010 Transplants, % Age £ 20 yrs Age > 20 yrs Slide 12 SUM12_32.ppt
Unrelated Cord Blood Transplants by AgeRegistered with the CIBMTR2001-2010 Number of Transplants * * Data incomplete Slide 13 SUM12_33.ppt
One-year Survivalby Year of Transplant, Donor and Age, Worldwide, 1997-2010- In any remission, Acute Leukemia, CML or MDS- One-Year Survival, % Slide 14 SUM12_34.ppt
100-day Mortality after Autologous Transplants, 2010 Mortality, % Slide 15 SUM12_35.ppt
100-day Mortality after HLA-identical Sibling Transplants,2010 Early Disease Intermediate Disease Advanced Disease Chronic Phase Accelerated Phase Blast Phase Other Mortality, % Slide 16 SUM12_36.ppt
100-day Mortality after Unrelated Donor Transplants,2008-2009 Early Disease Intermediate Disease Advanced Disease Chronic Phase Accelerated Phase Blast Phase Other Mortality, % Slide 17 SUM12_37.ppt
Causes of Death after Transplants Done in2009-2010 HLA-identical Sibling Primary Disease (49%) New Malignancy (1%) GVHD (16%) Unrelated Donor Infection (13%) Primary Disease (37%) New Malignancy (1%) Organ Failure (5%) Other (16%) GVHD (18%) Autologous Primary Disease (72%) New Malignancy (1%) Infection (7%) Infection (18%) Other (18%) Organ Failure (3%) Organ Failure (8%) Other (17%) Slide 18 SUM12_38.ppt
Allogeneic TransplantsRegistered with the CIBMTR, 2001-2010 - by Conditioning Regimen Intensity & Age - Number of Transplants * * Data incomplete Slide 19 SUM12_39.ppt
Allogeneic Transplants after Reduced-intensity Conditioning, by Donor Type, Registered with CIBMTR1998-2010 Number of Transplants Slide 20 SUM12_40.ppt
Percentage of Reduced Intensity Conditioning Allo-HCTs, Registered with CIBMTR, 1998-2010- by Year of Transplant & Disease - One-Year Survival, % Slide 21 SUM12_41.ppt
Indications for Hematopoietic Stem Cell Transplants for Age ³ 50yrs, in the U.S., 2010 Number of Transplants Slide 22 SUM12_42.ppt
Allogeneic Transplants in the U.S.,Registered with the CIBMTR, 2007-2011 - by Donor Type - Transplants, % Slide 23 SUM12_43.ppt
Hematopoietic Cell Transplant Comorbid Index of U.S. Transplant Recipientsby Group Age2008-2011 Transplants, % Slide 24 SUM12_44.ppt
Probability of Survival after HLA-identical Sibling Donor Transplants for AML, 2000-2010- By Disease Status - 100 100 90 90 80 80 70 70 60 60 Early (N=7,210) Probability of Survival, % 50 50 40 40 Intermediate (N=1,906) 30 30 20 20 Advanced (N=2,923) 10 10 P < 0.0001 0 0 1 3 0 2 4 5 6 Years Slide 25 SUM12_2.ppt
Probability of Survival after Unrelated Donor Transplants for AML, 2000-2010- By Disease Status - 100 100 90 90 80 80 70 70 60 60 Probability of Survival, % 50 50 Early (N=5,364) 40 40 Intermediate (N=3,374) 30 30 20 20 Advanced (N=3.702) 10 10 P < 0.0001 0 0 1 3 0 2 4 5 6 Years Slide 26 SUM12_3.ppt
Survival after HLA-identical Sibling Donor Transplants for AML, Age <20 yrs, 2000-2010- by Disease Status - 100 100 90 90 80 80 70 70 Early (N=1,292) 60 60 Probability of Survival, % 50 50 Intermediate (N=268) 40 40 30 30 Advanced (N=270) 20 20 10 10 P < 0.0001 0 0 1 3 0 2 4 5 6 Years Slide 27 SUM12_4.ppt
Probability of Survival after Autologous Transplants for AML, 2000-2010- by Disease Status - 100 100 90 90 80 80 70 70 60 60 Intermediate (N=735) Probability of Survival, % 50 50 40 40 Early (N=2,139) 30 30 20 20 Advanced (N=152) 10 10 P < 0.0001 0 0 1 3 0 2 4 5 6 Years Slide 28 SUM12_5.ppt
Probability of Survival after Allogeneic Transplants for MDS, 2000-2010- by Disease Status and Donor Type - 100 100 90 90 80 80 70 70 Early, sibling donor (N=750) 60 60 Early, unrelated donor (N=890) Probability of Survival, % 50 50 40 40 Advanced, unrelated donor (N=1,660) 30 30 20 20 Advanced, sibling donor (N=1,407) 10 10 P < 0.0001 0 0 1 3 0 2 4 5 6 Years Slide 29 SUM12_6.ppt
Survival after HLA-identical Sibling Donor Transplants for ALL, Age < 20 yrs,2000-2010- by Disease Status - 100 100 90 90 80 80 70 70 Early (N=849) 60 60 Probability of Survival, % 50 50 Intermediate (N=1,203) 40 40 30 30 20 20 Advanced (N=210) 10 10 P < 0.0001 0 0 1 3 0 2 4 5 6 Years Slide 30 SUM12_7.ppt
Probability of Survival after Unrelated Donor Transplants for ALL, Age < 20 yrs, 2000-2010- By Disease Status - 100 100 90 90 80 80 70 70 Early (N=977) 60 60 Probability of Survival, % 50 50 40 40 Intermediate (N=2,034) 30 30 20 20 Advanced (N=289) 10 10 P < 0.0001 0 0 1 3 0 2 4 5 6 Years Slide 31 SUM12_8.ppt
Survival after HLA-identical Sibling Donor Transplants for ALL, Age ³ 20 yrs, 2000-2010- By Disease Status - 100 100 90 90 80 80 70 70 60 60 Early (N=2,214) Probability of Survival, % 50 50 40 40 Intermediate (N=715) 30 30 20 20 Advanced (N=584) 10 10 P < 0.0001 0 0 1 3 0 2 4 5 6 Years Slide 32 SUM12_9.ppt
Probability of Survival after Unrelated Donor Transplants for ALL, Age ³ 20 yrs, 2000-2010- By Disease Status - 100 100 90 90 80 80 70 70 60 60 Early (N=1,818) Probability of Survival, % 50 50 40 40 30 30 Intermediate (N=1,075) 20 20 10 10 Advanced (N=767) P < 0.0001 0 0 1 3 0 2 4 5 6 Years Slide 33 SUM12_10.ppt
Probability of Survival after HLA-identical Sibling Donor Transplants for CML, 1998-2010- By Disease Status and Transplant Year - 100 100 90 90 80 80 CP, 2001-2010 (N=2,498) 70 70 CP, 1998-2000 (N=2,239) 60 60 AP, 2001-2010 (N=360) Probability of Survival, % 50 50 40 40 AP, 1998-2000 (N=291) 30 30 20 20 10 10 P < 0.0001 0 0 1 3 0 2 4 5 6 Years Slide 34 SUM12_11.ppt
Survival after Autologous and HLA-matched Sibling Donor Hematopoietic Cell Transplants for CLL, 2000-2010- by Donor Type and Conditioning Regimen Intensity - 100 100 90 90 Autologous transplant (N=270) 80 80 70 70 60 60 Probability of Survival, % 50 50 Myeloablativeconditioning (N=450) 40 40 Reduced-intensity conditioning (N=871) 30 30 20 20 10 10 P < 0.0001 0 0 1 3 0 2 4 5 6 Years Slide 35 SUM12_12.ppt
Probability of Survival after Allogeneic Transplants for SAA, 2000-2010- By Donor Type and Age - 100 100 £ 20y, Sibling Donor (N=1,375) 90 90 80 80 > 20y, Sibling Donor (N=1,425) 70 70 £ 20y, Unrelated Donor (N=654) 60 60 > 20y, Unrelated Donor (N=634) Probability of Survival, % 50 50 40 40 30 30 20 20 10 10 P < 0.0001 0 0 1 3 0 2 4 5 6 Years Slide 36 SUM12_13.ppt
Probability of Survival after Autologous Transplants for Hodgkin Disease, 2000-2010- By Disease Status - 100 100 90 90 CR (N=2,907) 80 80 70 70 60 60 Not in CR, sensitive (N=3,832) Probability of Survival, % 50 50 Not in CR, resistant (N=1,237) 40 40 30 30 20 20 10 10 P < 0.0001 0 0 1 3 0 2 4 5 6 Years Slide 37 SUM12_14.ppt
Probability of Survival after Allogeneic Transplants for Hodgkin Disease, 2000-2010- By Conditioning Regimen and Donor Type - 100 100 90 90 80 80 70 70 60 60 Probability of Survival, % 50 50 Sibling Donor (N=356) 40 40 30 30 Unrelated Donor (N=205) 20 20 10 10 P = 0.226 0 0 1 3 0 2 4 5 6 Years Slide 38 SUM12_15.ppt
Survival after Autologous Transplants for Follicular Lymphoma, 2000-2010- By Disease Status - 100 100 90 90 80 80 Sensitive (N=2,676) 70 70 60 60 Probability of Survival, % 50 50 Resistant (N=279) 40 40 30 30 20 20 10 10 P < 0.0001 0 0 1 3 0 2 4 5 6 Years Slide 39 SUM12_16.ppt
Probability of Survival after Allogeneic and HLA-identical Sibling Transplants for Follicular Lymphoma, 2000-2010- By Disease Status - 100 100 90 90 80 80 Sensitive (N=840) 70 70 60 60 Probability of Survival, % 50 50 Resistant (N=212) 40 40 30 30 20 20 10 10 P = 0.002 0 0 1 3 0 2 4 5 6 Years Slide 40 SUM12_17.ppt
Probability of Survival after Autologous Transplants for Diffuse Large B-Cell Lymphoma, 2000-2010- By Disease Status - 100 100 90 90 80 80 70 70 Sensitive (N=8,891) 60 60 Probability of Survival, % 50 50 40 40 30 30 Resistant (N=1,033) 20 20 10 10 P < 0.0001 0 0 1 3 0 2 4 5 6 Years Slide 41 SUM12_18.ppt
Probability of Survival after HLA-identical Sibling Transplants for Diffuse Large B-Cell Lymphoma, 2000-2010- By Disease Status - 100 100 90 90 80 80 70 70 60 60 Probability of Survival, % 50 50 Sensitive (N=503) 40 40 30 30 20 20 Resistant (N=219) 10 10 P < 0.0001 0 0 1 3 0 2 4 5 6 Years Slide 42 SUM12_19.ppt
Probability of Survival after Transplants for Mantle Cell Lymphoma, 2000-2010- By Donor Type - 100 100 90 90 80 80 70 70 Autologous (3,173) 60 60 Probability of Survival, % 50 50 Sibling donor (N=554) 40 40 30 30 Unrelated donor (N=389) 20 20 10 10 P < 0.0001 0 0 1 3 0 2 4 5 6 Years Slide 43 SUM12_20.ppt
Probability of Survival after Transplants for Multiple Myeloma, 2000-2010- By Donor Type - 100 100 90 90 80 80 Autologous (N27,979) 70 70 60 60 Probability of Survival, % 50 50 40 40 Sibling Donor (N=892) 30 30 20 20 Unrelated donor (N=380) 10 10 P < 0.0001 0 0 1 3 0 2 4 5 6 Years Slide 44 SUM12_21.ppt