Download
1 / 17
180 likes | 380 Views
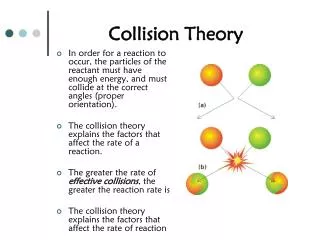
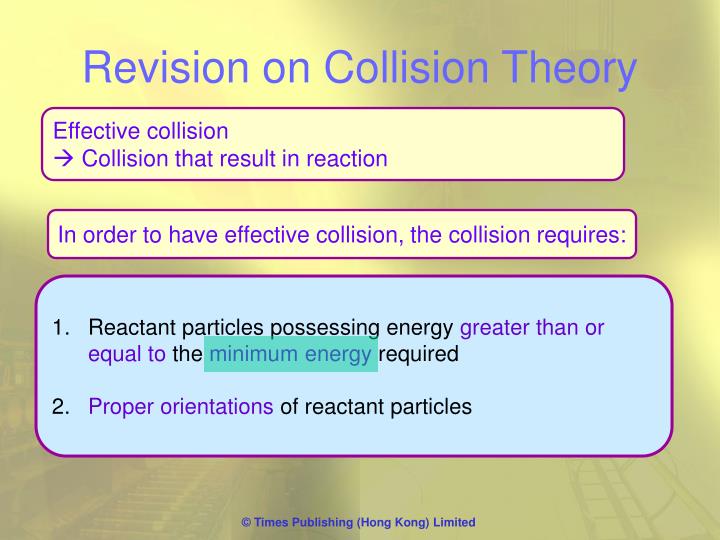
Revision on Collision Theory. Effective collision Collision that result in reaction. In order to have effective collision, the collision requires:. Reactant particles possessing energy greater than or equal to the minimum energy required Proper orientations of reactant particles.

E N D
Revision on Collision Theory Effective collision Collision that result in reaction In order to have effective collision, the collision requires: • Reactant particles possessing energy greater than or equal to the minimum energy required • Proper orientations of reactant particles
Activation energy and energy profile • Activation energy (Ea) is the minimum energy required for a reaction to get started, so it is also known as the energybarrier • Ea is the energy needed to break chemical bonds at the molecular level (iStockphoto.com/ Kent Weakley) (A) Activation energy • Ea is specific for each reaction The Ea needed to initiate explosion is very low • Ea can only be found by experiment
An energy profile is a graph showing the changes of energy content of a system when a chemical reaction proceeds (B) Energy profile Also called activated complex; which is extremely unstable and cannot be isolated The energy difference between reactants and the transition state is the Ea Reactants lose energy to form products: an exothermic reaction
Transition state[A • • •B • • •C] Ea A – B + C ∆H A + B – C Energy profile for one-step reactions e.g. A hypothetical reaction between A — B and C: A — B + C [A • • • • • •B • • • • • •C] A + B — C Reactants Products A partially broken bond A partially formed bond Activation energy/ energy barrier to overcome to reach the transition state Products have a lower energy content than the reactants Reactants release energy to form products: an exothermic reaction
The RDS slow fast Overall reaction: D — E + F D — F + E Transition state 2 Transition state 1 E2 E1 Intermediate + F D – E + F (Reactants) D + E – F (Products) Energy profile for multi-step reactions Do Q.2, 3 on p. 97 e.g. A hypothetical reaction between D — E and F: Step 1: D — E intermediate Step 2: intermediate + F D — F + E Both steps are called the elementary steps and its rate equation represents that of the overall reaction which possesses the highest Ea step 1 is the slowest step in the reaction Activation energy of step 1 it is called the rate-determining step Activation energy of step 2 This is an exothermic reaction because after the reaction steps the products are lower in energy content Intermediate is much more stable than transition state and can be isolated
Relationship between temperature and reaction rate Maxwell-Boltzmann distribution curve • For a reaction to proceed, the reactant particles must possess kinetic energy greater than or equal to the activation energy, Ea. • Two questions follow: • Do all reactant particles have the same kinetic energy at the same temperature? • Do reactant particles at different temperatures have different kinetic energies?
In a sample of gas, • The particles move around randomly and under continuous collision with each other. • During the collisions, kinetic energy is transferred between the particles. • Some particles may gain kinetic energy while other may lose, ends up with some particles having higher kinetic energy while others having lower kinetic energy. • Answer to the 1st question: Not all the particles have the same kinetic energy in the gas sample.
Blue area under the curve = ------------------------------------------ Total area under the curve • Then, how do the kinetic energies distribute among the gaseous particles? • Maxwell-Boltzmann distribution curve. Area under the curve: total number of particles in the gas sample Area in blue: the number of particles with energy higher than E • Fraction of particles with kinetic energy ≥ E
Characteristic features of the Maxwell-Boltzmann distribution curve: • Very few particles with very low / very high kinetic energies • The maximum point of the curve represents the kinetic energy shared by the largest number of particles. This energy is called the most probable kinetic energy
A. Increase in the most probable kinetic energy When temp increases • The effect of temperature change (p.80) • Changes to the Maxwell-boltzmann distribution curve: • The new curve has a similar shape but the maximum moves to the right and the curve becomes flatter • The peak shifts to the right, indicating the most probable kinetic energy increases • The number of particles possessing the most probable kinetic energy decreases • The area under the curves remains unchanged
B. More particles with kinetic energy equal to or greater than the activation energy • When temp increases, the amount of particles having kinetic energy greater than or equal to the activation energy increases Do Check Point 52.3 Do Q. 6 on p. 98 • Therefore, more particles can overcome the energy barrier and react to form products. As the frequency of effective collision increases, the reaction rate increases Q. 2. Do reactant particles at different temperatures have different kinetic energies? • Answer to the 2nd question: reactant particles have differentkinetic energies at different temperatures. This explains the dependence ofreaction rateon temp.
Determination of activation energy of chemical reaction by Arrhenius equation Arrhenius equation • For the same initial concentrations of reactants: temperature increases rate increases k increases • In 1889, the Swedish chemist Svante Arrhensius put forward the quantitative relationship between temperature and rateconstant of a reaction… • From Maxwell-Boltzmann distribution curve: temperature increases no.of particles with K.E. > Ea
Ea Arrhenius equation RT k A e = where • k is the rateconstant of the reaction • A represents the collision frequency, called the frequencyfactor. It is a constant for a given reacting system • e represents the base of natural logarithm – related to Maxwell-Boltzmann distribution curve • Ea is the activationenergy of the reaction in J mol–1 • R is the universalgasconstant (i.e. 8.314 J K–1 mol–1) • T is the temperature in Kelvin Temperature scale
Arrhenius equation (cont'd) Ea k = Ae RT Ea ln k = In A RT Ea log k = Iog A 2.3RT • Taking the natural logarithm on both sides, • Changing the natural logarithm to logarithm with base 10,
Ea log k = Iog A 2.3RT Ea 1 2.3R T + c (y-intercept) y = m x • A plot of log k against 1/T gives a straight line whose slope is equal to and the activation energy of the reaction can be calculated. Ea 2.3R Determine the activation energy of reaction: Do Check Point 52.4A on p. 85 • Graphical method: • From the equation • since Ea and R are constant, rearrange the equation into a linear equation: log k = + log A
Ea Ea log k2 = Iog A log k1 = Iog A 2.3RT2 2.3RT1 Ea Ea log k1 – log k2 = 2.3RT2 2.3RT1 1 1 Ea k1 log = 2.3R T1 T2 k2 • From two rate constants at two different temperatures • At temperature T1 …………….. (1) Do Q. 8 on p.98 • At temperature T2 …………….. (2) • Subtracting equation (2) from equation (1) • The activation energy of the reaction can be calculated
k∝ • Substituting k by in the following equation: 1 1 1 Ea t t t log k = Iog A 2.3RT 1 Ea log = constant t 2.3RT Ea 2.3R Experimental method • The activation energy can be found by measuring the time for a reaction to reach an easily observable change at different temperatures • since the rate of a reaction is directly proportional to k and inversely proportional tothe time taken (t) for a designated observable change to occur Rate of reaction ∝ Rate of reaction ∝k and • A plot of log 1/t against 1/T gives a straight line whole slope is equal to