Download
1 / 1
10 likes | 128 Views
An analysis of fruit and vegetable access in Saskatoon’s grocery stores. Methods The Nutrition Environment Measurement Survey for Stores (NEMS-S) was used to assess a census of 131 food stores in Saskatoon’s 60 residential neighbourhoods.

E N D
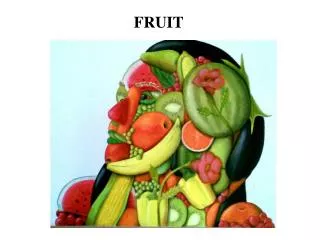
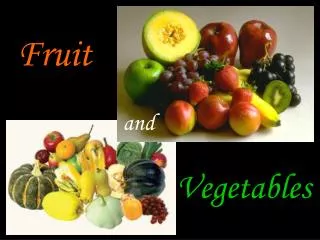
An analysis of fruit and vegetable access in Saskatoon’s grocery stores Methods The Nutrition Environment Measurement Survey for Stores (NEMS-S) was used to assess a census of 131 food stores in Saskatoon’s 60 residential neighbourhoods. (NEMS-S) measures 10 food categories for price, availability and quality, generating a composite “score” for each store (3). Residential neighbourhoods were grouped into high, mid and low SES based on the Material and Social Deprivation Index (using variables derived from Statistic Canada’s 2006 Census and projected data from the City of Saskatoon up to 2010) • Material: income, education, unemployment • Social: marital status, lone parent status and living alone status 131 food stores in Saskatoon were measured • 24 grocery stores • 92 convenience stores • 15 specialty stores The disproportionately high distribution of convenience stores in lower SES neighbourhoods provides evidence of food swamps, areas in which there are an over-representation of unhealthy food stores (5). Combined with the higher prices of F/V in these neighbourhoods, as well as in neighbourhoods that have a higher proportion of Aboriginal residents, these finding are worrisome. Previous research (6) has indicated that residents of Saskatoon's poorest neighbourhoods experience worse health outcomes compared to the rest of the city. People with lower incomes and reduced options for transportation are more affected by their built food environment, and this study indicates that, in Saskatoon, they have lower access to a healthy and affordable diet. Background What is the food environment? Table 1: Distribution of grocery and convenience stores by neighbourhood-level SES Results and Discussion Conclusions Objectives and Methods Study Strengths and Limitations Strengths This is the first study in Saskatoon to measure in-store offerings of all grocery stores and to enumerate the built consumer food environment. These results provide a strong base upon which to compare Saskatoon with other Canadian cities, and lays the groundwork for further analysis. Limitations As a cross-sectional study,changes in F/V availability over time are not captured. NEMS-S did not capture the F/V offerings of ethnic grocery stores (eg. guava), and these stores were not included in the analysis. The sample size for F/V analysis (n=24 grocery stores) is small, and results must be interpreted with caution. However, consistent with other research findings in Saskatoon (6) this study further indicates that significant health inequities exist in the city’s poorest neighbourhoods and among the city’s Aboriginal population. References Objectives Using an ecological, cross-sectional design, this study aims to enumerate access to healthy food options in the city’s grocery and convenience stores. The purpose of this phase of the study is to evaluate the relationship between the price and availability of fruits and vegetables (F/V) in grocery stores with neighbourhood-level SES and demographic characteristics in Saskatoon. Sugandhi del Canto1, Rachel Engler-Stringer,1, 2Nazeem Muhajarine1,2and Smart Cities, Healthy Kids research team 1 Department of Community Health and Epidemiology, University of Saskatchewan;2 Saskatchewan Population Health and Evaluation Research Unit Saskatoon is a mid-sized, Canadian city in the Prairies that has seen significant population growth over the last few years. While the body of Canadian food environment literature is growing, little has been documented, thus far, about the Prairie-specific context. This study, the first of its kind in the city, aims to measure in-store food offerings and assess relationships with neighbourhood-level socio-economic status (SES). The quantitative findings presented here are part of a mixed methods dissertation that incorporates qualitative assessments of food environment perceptions among mothers in Saskatoon. All photographs used were taken by mothers participating in the photo-voice project in the qualitative phase of this study. Townshend T, Lake A (2009). Obesogenic urban form: Theory, policy and practice. Health Place, 15(4):909-16. Lytle LA. Measuring the food environment: state of the science. Am J Prev Med. 2009;36(4S):S134–S144. Glanz K, Sallis JF, Saelens BE, Frank LD. Healthy nutrition environments: concepts and measures. Am J health Promot 2005; 19(5): 330-333 Kershaw T, Creighton T, Markham T, Marko J. Food access in Saskatoon. 2010: Saskatoon Health Region. Health Canada. (2013). Measuring the Food Environment in Canada. Health Canada; Ottawa, ON LemstraM, Neudorf C, Beaudin G. Health disparity knowledge and support for intervention in Saskatoon. CJPH November 2007 (98)6 Figure 2: Distance to Nearest Supermarket in Saskatoon (4) †Includes all grocery, convenience and specialty food stores. As such, percentages in the last two columns will not equal 100% *p=0.007 **p=0.052 • Chi-square tests were used to assess differences in grocery and convenience store distribution. While each neighbourhood had at least one convenience store, only 18 neighbourhoods had grocery stores. • High SES neighbourhoods have a higher proportion of grocery stores (of all 3 store types). • Low SES neighbourhoods have a higher proportion of convenience stores. • ANOVAs and correlation tests among grocery stores indicated that: • Overall NEMS-S scores did not vary by SES, but did vary by proportion of Aboriginal residents. • Availability of F/V did not differ by SES nor with proportion of Aboriginal residents • Price of F/V was higher in low SES neighbourhoods and in those with a higher proportion of Aboriginal residents The food environment is any opportunity to obtain food. This can include physical, socio-cultural, economic and policy factors at both micro- and macro-levels (1). Food environments include the accessibility and availability of food, as well as the marketing and advertising of food and food products (2). The Community Nutrition Environments Model (Figure 1) is useful for conceptualizing the relationship between food and health outcomes (3). Aspects of each of these environments influence both individual- and population-level health (4). The study presented here focuses on the built community and consumer food environments, which can be thought of as the choice and access between different food retail outlets, as well as the choice and access within food retail outlets. Table 2: Fruit and vegetable access in Saskatoon's grocery stores Figure 1: Model of Community Nutrition Environments (3) *p=0.035 **p=0.023 ***p=0.02 ****p=0.037 *****p=0.001