Download
1 / 35
350 likes | 429 Views
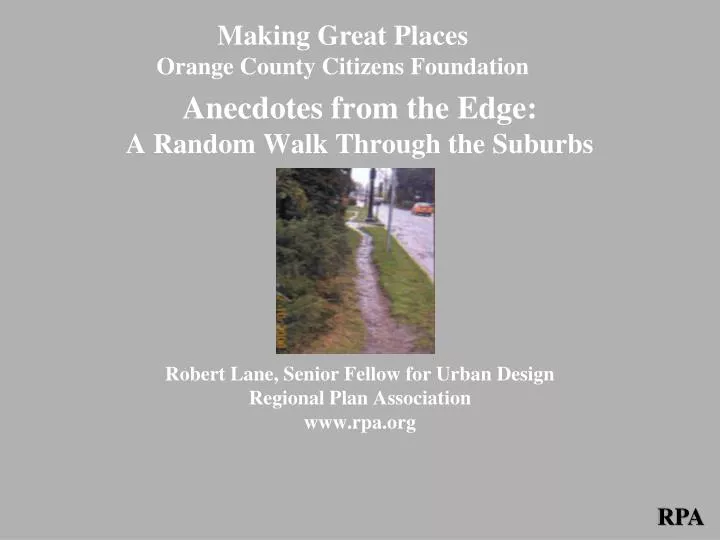
Making Great Places Orange County Citizens Foundation. Anecdotes from the Edge: A Random Walk Through the Suburbs Robert Lane, Senior Fellow for Urban Design Regional Plan Association www.rpa.org. Anecdote from the Edge: My Trip to Whole Foods. 6 Miles. Why do we care?.

E N D
Making Great Places Orange County Citizens Foundation Anecdotes from the Edge:A Random Walk Through the SuburbsRobert Lane, Senior Fellow for Urban DesignRegional Plan Association www.rpa.org
Why do we care? We can’t build our way out of this No Option Congestion Widen Road Size, Not Congestion is the Choice Reduced Options Congestion Widen Choice Traffic Congestion Capacity Years
Why do we care? We can’t build our way out of this New Approach to Transportation Planning System Management More Roads More Lanes Walk Transit Bike ITS Access, Not Mobility Driver-Eye View Business Friendly Traffic Calming Streets as Centerpiece More Pavement More Use Improve Quality of Travel Land Use Road Network Pricing Telecommuting Sizing of Destinations In-Town Living Move People, Not Cars Move Less People, Fewer Miles VERTICAL APPROACH Move Cars Manage, Not “Solve” Lane Limits Change Standards LATERAL APPROACH Source: Glatting Jackson
Why do we care? Walking affects property values
Why do we care? Walking affects property values
Why do we care? Walking affects property values
Why do we care? A cleaner environment
Why do we care? A cleaner environment
Why do we care? We’re healthier when we walk 1900 1996 Pneumonia Heart Disease Tuberculosis Cancer Stroke Heart Disease Chronic Lung Disease Stroke Accidents Liver Disease Pneumonia/Influenza Injuries Diabetes Cancer HIV Senility Suicide Diphtheria Chronic Liver Disease 0 10 20 0 5 10 15 20 25 30 35 Diarrhea/Enteritis Percentage Percentage Morbidity Associated with Inactivity Coronary Heart Disease Obesity Diabetes Stroke Colorectal Cancer The average life expectancy in 1900 was 47.3 years of age. In 1993, it was 75.7 years of age. SOURCE: CDC, National Center for Health Statistics The 10 Leading Causes of Death as a Percentage of All Deaths United States, 1900 and 1996
Why do we care? We’re healthier when we walk Walking is declining, while the number of overweight adults is climbing. Based on data from the Nationwide Personal Transportation Survey and the Centers for Disease Control and Prevention.
Why do we care? We’re healthier when we walk Children walk less and weigh more. Based on data from the Nationwide Personal Transportation Survey and the Centers for Disease Control and Prevention.
Why do we care? We’re healthier when we walk More people are overweight in places where people walk less. • 2-3 times higher walk/bike trip rates in traditional versus suburban • 1-2 more walk/bike trips per resident per week • Living in walkable neighborhood could prevent .8 to 1.7 lbs of weight gain/year
Why do we care? We’re healthier when we walk Walk Trips 1977-1995 Auto Trips 1977-1995 Percent Source: Nationwide Personal Transportation Survey, 1995
Why do we care? We’re healthier when we walk Growth in VMT vs. Growth in “Overweight” Growth trend for annual household vehicle miles of travel Growth trend for percent of Americans ‘overweight’ (50% overall growth) (40% overall growth)
Why do we care? We’re healthier when we walk 5.0 4.0 3.0 2.0 1.0 1994 1996 0.0 <.20 .20-.50 .50-.70 >.70 Walk/Bike Trips and Connectivity Cul-de-sac: 1.5 miles Mean Number of Non-vehicle Trips Number of Blocks per Hectare in Home Census Tract Grid: 0.5 miles Non-Vehicle Trips = walk and bike trips. Source: Puget Sound Transportation Panel
Part II: Anecdotes from the Edge Anecdote from the Edge: “…but they did all the right things…”
Anecdote from the Edge: “…but they did all the right things…”
Anecdote from the Edge: “…but they did all the right things…”
Lesson Learned: • People need a reason to walk
Anecdote from the Edge: I’m no scientist • Lesson Learned: • The reasons are complicated
Anecdote from the Edge: Beyond the Perfect Circle • Lesson Learned: • Ped/bike sheds are irregular Raritan (NJ) Industrial Park
Anecdote from the Edge: Man, it’s lumpy out there • Lessons Learned: • Let’s Pick our battles • One size won’t fit All
Lessons Learned: Walking and Biking are a lot like transit • Lessons Learned: • People need a reason to walk • The reasons are complicated • Ped/bike sheds are irregular • Let’s Pick our battles • One size won’t fit All Transit use, walking, and biking increase with density and land use mix as shorter trips make them possible.
Part III: The Good News Things are changing
The Good News The Public Controls the Streets
Current Complete Streets Policies State policies & laws: MA, CT, PA, DE, CA, OR, HI Pending statewide policy in NY Assembly Bill 8587 Local codes & policies: Hundreds in 20+ states Binghamton, Buffalo, Erie County, NYC Varies from guidance to standards The Good News Government Gets It Buffalo, NY
Examples of Connectivity Policies Virginia State DOT Required of new subdivisions Enables narrower streets Charlotte, NC Required of new subdivisions and city streets Reduces cost of city services (i.e. Fire Dept.) The Good News Government Gets It
The Good News Cheap and Simple Works