Download
1 / 26
260 likes | 419 Views
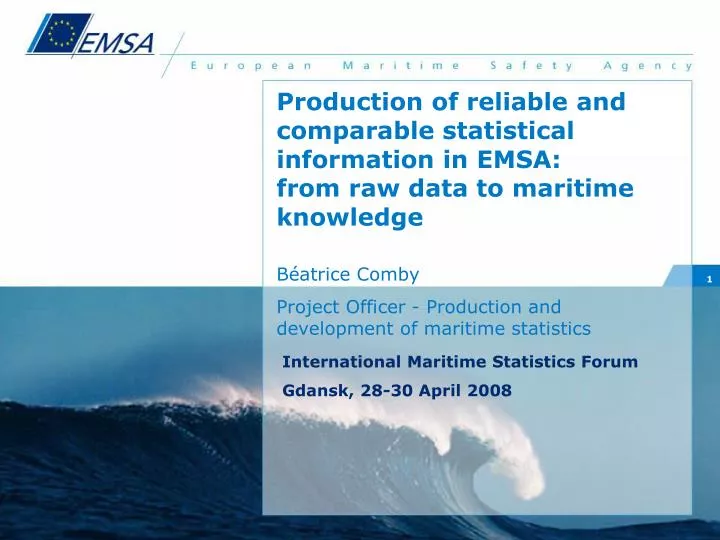
Production of reliable and comparable statistical information in EMSA: from raw data to maritime knowledge Béatrice Comby Project Officer - Production and development of maritime statistics . International Maritime Statistics Forum Gdansk, 28-30 April 2008. Raw data.

E N D
Production of reliable and comparable statistical information in EMSA: from raw data to maritime knowledge Béatrice Comby Project Officer - Production and development of maritime statistics International Maritime Statistics Forum Gdansk, 28-30 April 2008
Raw data Statistical information Maritime knowledge
Scope • Data collected by EMSA belong to Member States (“Top up”) • Safe Sea Net => index server • Port State Control => Paris MoU Secretariat • Data purchased with restricted use • Non commercial • Internal • Other data processed with limited mandate • Equasis • Pilot projects with Member States (HNS)
Type 1 – Information systems managed by EMSA • Vessel Traffic Monitoring (Safe Sea Net) • Port State Control (THETIS) • LRIT EU Data Center • Accident investigation • Satellite monitoring (Clean Sea Net) • AIS (STIRES) 2 - Data purchased from commercial providers Mainly: • Ship particulars • Ship movements
Use Example: calculation of risk profile SIRENAC (current) THETIS (after 2010) At the time of the LAST INSPECTION At the time of the CALL
Scenario 1 history factor = 0
+ 16 + 1 X 2,8 compared to scenario1 Scenario 2 Scenario 1 + Flag change
+ 3 + 1 + 2 X 3,5 compared to scenario1 Scenario 3 Scenario 2 + Class change
X 5,8 compared to scenario 1 Scenario 4 Scenario 3 + History change + 20
Methodology Avoid double counting • Flag: the sum of each Member State total does not equals the EU total • Late reporting = possible overlaps (ex conflict MMSI/flag) Ensure correct definitions apply • Ex: build year = 4 different definitions according to regulations Audit quality Document methodology
Products Yearly statistics • EQUASIS Publication • Report to COM (RoRo Ferry surveys, banned ships, etc..) Monthly statistics • EU waters • EU fleet • Key indicators Ad-hoc • Impact studies • Preparation of visits to Member States • Technical reports
Main areas • Coding • Vessels • Movements • Cargo
Coding Example: flag • EU fleet? • Difference between flag and registers. Ex: GB possible registers : • Isle of Man • Bermuda • Gibraltar • Cayman Islands • Falkland Islands • British Virgin Islands • St Helena • Antigua • Turks and Caicos Islands • Jersey • Guernsey • Montserrat
Vessels Example: MMSI / Flag SafeSeaNet National administrations LRIT Checks / Validation rules THETIS STIRES Other sources
Movements Example: UNLOCODES
Cargo Example: Pilot project on HNS transportation • Top up approach at the request of MS • Data collected by national administration • Risk assessment / anti pollution preparedness
Thank you www.emsa.europa.eu