Download
1 / 1

E N D
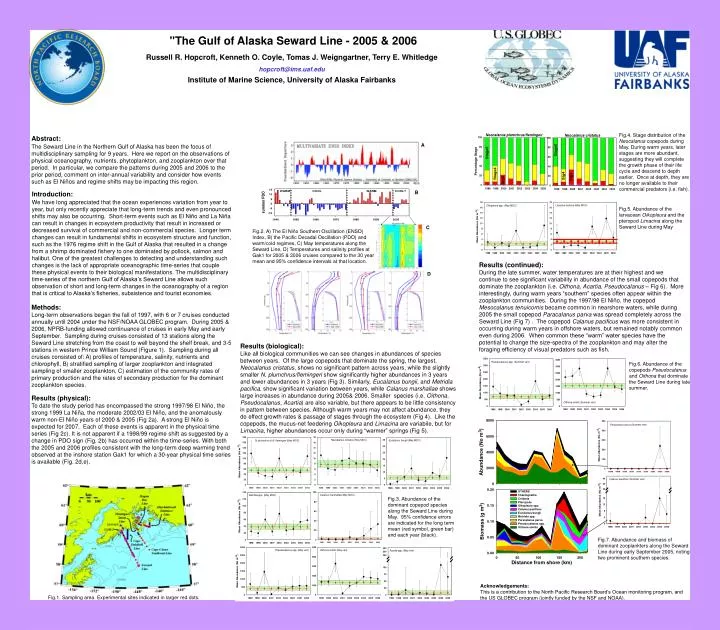
A B C Fig.2. A) The El NiñoSouthern Oscillation (ENSO) Index, B) the Pacific Decadal Oscillation (PDO) and warm/cold regimes, C) May temperatures along the Seward Line, D) Temperatures and salinity profiles at Gak1 for 2005 & 2006 cruises compared to the 30 year mean and 95% confidence intervals at that location. D "The Gulf of Alaska Seward Line - 2005 & 2006 Russell R. Hopcroft, Kenneth O. Coyle, Tomas J. Weigngartner, Terry E. Whitledge hopcroft@ims.uaf.edu Institute of Marine Science, University of Alaska Fairbanks Fig.4. Stage distribution of the Neocalanus copepods during May. During warm years, later stages are more abundant, suggesting they will complete the growth phase of their life cycle and descend to depth earlier. Once at depth, they are no longer available to their commercial predators (i.e. fish). Abstract: The Seward Line in the Northern Gulf of Alaska has been the focus of multidisciplinary sampling for 9 years. Here we report on the observations of physical oceanography, nutrients, phytoplankton, and zooplankton over that period. In particular, we compare the patterns during 2005 and 2006 to the prior period, comment on inter-annual variability and consider how events such as El Niños and regime shifts may be impacting this region. Introduction: We have long appreciated that the ocean experiences variation from year to year, but only recently appreciate that long-term trends and even pronounced shifts may also be occurring. Short-term events such as El Niño and La Niña can result in changes in ecosystem productivity that result in increased or decreased survival of commercial and non-commercial species. Longer term changes can result in fundamental shifts in ecosystem structure and function, such as the 1976 regime shift in the Gulf of Alaska that resulted in a change from a shrimp dominated fishery to one dominated by pollock, salmon and halibut. One of the greatest challenges to detecting and understanding such changes is the lack of appropriate oceanographic time-series that couple these physical events to their biological manifestations. The multidisciplinary time-series of the northern Gulf of Alaska’s Seward Line allows such observation of short and long-term changes in the oceanography of a region that is critical to Alaska’s fisheries, subsistence and tourist economies. Fig.5. Abundance of the larvacean Oikopleura and the pteropod Limacina along the Seward Line during May Results (continued): During the late summer, water temperatures are at their highest and we continue to see significant variability in abundance of the small copepods that dominate the zooplankton (i.e. Oithona, Acartia, Pseudocalanus – Fig 6). More interestingly, during warm years “southern” species often appear within the zooplankton communities. During the 1997/98 El Niño, the copepod Mesocalanus tenuicornis became common in nearshore waters, while during 2005 the small copepod Paracalanus parva was spread completely across the Seward Line (Fig 7) . The copepod Calanus pacificus was more consistent in occurring during warm years in offshore waters, but remained notably common even during 2006. When common these “warm” water species have the potential to change the size-spectra of the zooplankton and may alter the foraging efficiency of visual predators such as fish. Methods: Long-term observations began the fall of 1997, with 6 or 7 cruises conducted annually until 2004 under the NSF/NOAA GLOBEC program. During 2005 & 2006, NPRB-funding allowed continuance of cruises in early May and early September. Sampling during cruises consisted of 13 stations along the Seward Line stretching from the coast to well beyond the shelf break, and 3-5 stations in western Prince William Sound (Figure 1). Sampling during all cruises consisted of: A) profiles of temperature, salinity, nutrients and chlorophyll, B) stratified sampling of larger zooplankton and integrated sampling of smaller zooplankton, C) estimation of the community rates of primary production and the rates of secondary production for the dominant zooplankton species. Results (biological): Like all biological communities we can see changes in abundances of species between years. Of the large copepods that dominate the spring, the largest, Neocalanus cristatus, shows no significant pattern across years, while the slightly smaller N. plumchrus/flemingeri show significantly higher abundances in 3 years and lower abundances in 3 years (Fig 3). Similarly, Eucalanus bungii, and Metridia pacifica, show significant variation between years, while Calanus marshallae shows large increases in abundance during 2005& 2006. Smaller species (i.e. Oithona,Pseudocalanus, Acartia) are also variable, but there appears to be little consistency in pattern between species. Although warm yearsmay not affect abundance, they do effect growth rates & passage of stages through the ecosystem (Fig 4). Like the copepods, the mucus-net feedering Oikopleura and Limacina are variabile, but for Limacina, higher abundances occur only during “warmer” springs (Fig 5). Fig.6. Abundance of the copepods Pseudocalanus and Oithona that dominate the Seward Line during late summer. Results (physical): To date the study period has encompassed the strong 1997/98 El Niño, the strong 1999 La Niña, the moderate 2002/03 El Niño, and the anomalously warm non-El Niñoyears of 2000 & 2005 (Fig 2a). A strong El Niño is expected for 2007. Each of these events is apparent in the physical time series (Fig 2c). It is not apparent if a 1998/99 regime shift as suggested by a change in PDO sign (Fig. 2b) has occurred within the time-series. With both the 2005 and 2006 profiles consistent with the long-term deep warming trend observed at the inshore station Gak1 for which a 30-year physical time series is available (Fig. 2d,e). Fig.3. Abundance of the dominant copepod species along the Seward Line during May. 95% confidence errors are indicated for the long term mean (red symbol, green bar) and each year (black). Fig.7. Abundance and biomass of dominant zooplankters along the Seward Line during early September 2005, noting two prominent southern species. Acknowledgements: This is a contribution to the North Pacific Research Board’s Ocean monitoring program, and the US GLOBEC program (jointly funded by the NSF and NOAA). Fig.1. Sampling area. Experimental sites indicated in larger red dots.