Download
1 / 29
290 likes | 465 Views
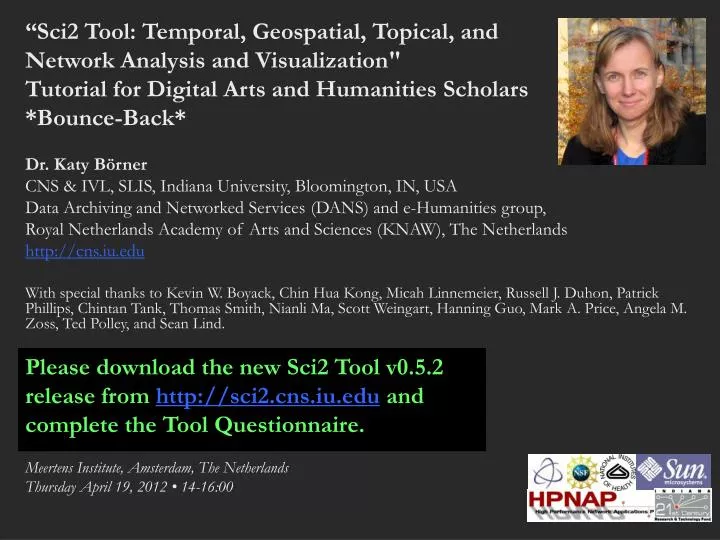
“Sci2 Tool: Temporal, Geospatial, Topical, and Network Analysis and Visualization" Tutorial for Digital Arts and Humanities Scholars *Bounce-Back* Dr. Katy Börner CNS & IVL, SLIS, Indiana University, Bloomington, IN, USA

E N D
“Sci2 Tool: Temporal, Geospatial, Topical, and Network Analysis and Visualization" Tutorial for Digital Arts and Humanities Scholars *Bounce-Back* Dr. Katy Börner CNS & IVL, SLIS, Indiana University, Bloomington, IN, USA Data Archiving and Networked Services (DANS) and e-Humanities group, Royal Netherlands Academy of Arts and Sciences (KNAW), The Netherlands http://cns.iu.edu With special thanks to Kevin W. Boyack, Chin Hua Kong, Micah Linnemeier, Russell J. Duhon, Patrick Phillips, Chintan Tank, Thomas Smith, NianliMa, Scott Weingart, HanningGuo, Mark A. Price, Angela M. Zoss, Ted Polley, and Sean Lind. Please download the new Sci2 Tool v0.5.2 release from http://sci2.cns.iu.edu and complete the Tool Questionnaire. Meertens Institute, Amsterdam, The Netherlands Thursday April 19, 2012 • 14-16:00
Software, Datasets, Plugins, and Documentation • These slides • http://ivl.slis.indiana.edu/km/pres/2012-borner-sci2tutorial-meertens-part2.pdf • Slides from original tutorial on Feb 16, 2012 • http://ivl.slis.indiana.edu/km/pres/2012-borner-sci2tutorial-meertens.pdf • Scott Weingart’s slides on Analyzing and Visualizing Correspondence Networks, July 1, 2011, Den Haag, The Netherlands.http://ivl.slis.indiana.edu/km/pres/2011-weingart-hague.pdf • Sci2 Tool Manual v0.5.1 Alpha http://sci2.wiki.cns.iu.edu • Sci2 Tool v0.5.2 Alpha (April 9, 2012) http://sci2.cns.iu.edu • Additional Datasets http://sci2.wiki.cns.iu.edu/2.5+Sample+Datasets • Additional Plugins http://sci2.wiki.cns.iu.edu/3.2+Additional+Plugins Or copy them from the memory stick. 2
Sci2 Tool v0.5.2 Alpha (April 9, 2012) • New Features • Support new Web of Science format from ISI • Support network overlay for geographical map • Support Prefuse's visualizations on Macs OS • Improvements • Improve memory usage and processing time of Extract top N nodes and Extract top N Edges algorithms • Unify merging algorithms used by database • Bug fixes • Fix legend boundary issue in geographical map • Fix typo error on the output data label • Fix slice by year algorithm 3
14:00 Welcome and Overview of Tutorial and Attendees 14:15 New Sci2 Functionality Horizontal Line Graphs Geomap with Gephi Network Overlay Adding a New Plugins, e.g., Cytoscape Optimizing the Menu System 15:15 Presentations by Participants 15:45 Q&A 16:00 Adjourn Tutorial Overview 4
14:00 Welcome and Overview of Tutorial and Attendees 14:15 New Sci2 Functionality Horizontal Line Graphs Geomap with Gephi Network Overlay Adding a New Plugins, e.g., Cytoscape Optimizing the Menu System 15:15 Presentations by Participants 15:45 Q&A 16:00 Adjourn Tutorial Overview 5
Horizontal line graph of NSF projects See 5.2.1 Funding Profiles of Three Universities (NSF Data) Download NSF data Visualize as Horizontal Line Graph Area size equals numerical value, e.g., award amount. Text Start date End date 6
Horizontal line graph of NSF projects NSF Awards Search via http://www.nsf.gov/awardsearch Save in CSV format as *institution*.nsf 7
Horizontal line graph of NSF projects Download and load a dataset of your choice or load one of the sample data files, e.g., ‘sampledata/scientometrics/nsf/Michigan.nsf.’ Run ‘Visualization > Temporal > Horizontal Line Graph’using parameters: Save ‘visualized with Hotizontal Line Graph’ as ps or eps file. Convert into pdf and view. Zoom to see details in visualizations of large datasets, e.g., all NSF awards ever made. 8
Horizontal line graph of NSF projects Area size equals numerical value, e.g., award amount. Text, e.g., title Start date End date More NSF data workflows can be found in wiki tutorial: 5.1.3 Funding Profiles of Three Researchers at Indiana University (NSF Data) 5.2.1 Funding Profiles of Three Universities (NSF Data) 5.2.3 Biomedical Funding Profile of NSF (NSF Data) 9
14:00 Welcome and Overview of Tutorial and Attendees 14:15 New Sci2 Functionality Horizontal Line Graphs Geomap with Gephi Network Overlay Adding a New Plugins, e.g., Cytoscape Optimizing the Menu System 15:15 Presentations by Participants 15:45 Q&A 16:00 Adjourn Tutorial Overview 10
Geomap with Gephi Network Overlay See 4.7.6 on http://sci2.wiki.cns.iu.edu File with geolocations and linkage info, e.g., an isibiblio-graphy file. Use Yahoo! Geocoder to identify Latitude, Longitude for each geolocation Extract attributes per geolocation, e.g., total times cited (TC) Extract linkages and their attributes, e.g., number of co-occurences See sample /geo/LaszloBarabasiGeo.net with co-occurrence of “Research Addresses” and full counting of TC per geolocation. Read into Sci2 Tool to generate geomap and network file Layout network in Gephi Combine geomap and network in Photoshop + = 11
Relevant Sci2 Manual entry http://sci2.wiki.cns.iu.edu/display/SCI2TUTORIAL/4.7+Geospatial+Analysis+%28Where%29#4.7GeospatialAnalysis%28Where%29-4.7.6UsingGephitoRenderNetworksOverlaidonGeoMaps 12
Use Sci2 Tool to Generate Geomapand Network File Read prepared .net file and run: Save map file as Postscript file and use Adobe or other view to read. It looks like: Save .net file as GraphML (Prefuse) and rename to .graphml so that Gephi can read it. 13
Use Gephito Generate Network Layout Start gephi. Use New Project > Open a graph file to read .graphmlfile that Sci2 generated. Follow instructions in online tutorial on Manipulating the Network File in Gephi 14
Use Gephi to Generate Network Layout Color or size code the “Near Alaska” and “Near Antarctica” anchor nodes to ease alignment of geomap and network overlay, see instructions in online tutorial on Manipulating the Network File in Gephi. Save result using File > Export > SVG/PDF file. 15
Use Photoshop to Overlay Network on Geomap Load geomap and network files into Photoshop. Select ‘network’ layer an use ‘Right click, Duplicate Layer’ to copy network over to ‘geomap’ file as a second layer. Use Edit > Transform > Scale’ and align using the “Near Antarctica” anchor nodes, see instructions in online tutorial on Creating the Visualization in Photoshop. 16
Practice these steps using “LaszloBarabasi-collaborations.net” linked from Sci2 wiki: 4.7.6 Using Gephi to Render Networks Overlaid on GeoMaps Rounded edges might increase legibility of overlapping lines. 19
Topic Mapping: UCSD Science Map Data: WoS and Scopus for 2001–2005, 7.2 million papers, more than 16,000 separate journals, proceedings, and series Similarity Metric: Combination of bibliographic coupling and keyword vectors Number of Disciplines: 554 journal clusters further aggregated into 13 main scientific disciplines that are labeled and color coded in a metaphorical way, e.g., Medicine is blood red and Earth Sciences are brown as soil. 20
14:00 Welcome and Overview of Tutorial and Attendees 14:15 New Sci2 Functionality Horizontal Line Graphs Geomap with Gephi Network Overlay Adding a New Plugins, e.g., Cytoscape Optimizing the Menu System 15:15 Presentations by Participants 15:45 Q&A 16:00 Adjourn Tutorial Overview 21
CIShell – Integrate New Algorithms CIShell Developer Guide is at http://cishell.wiki.cns.iu.edu Additional Sci2 Plugins are at http://sci2.wiki.cns.iu.edu/3.2+Additional+Plugins 22
CIShell – Add new Plugins, e.g., Cytoscape Adding more alyout algorithms and network visualization interactivity via Cytoscapehttp://www.cytoscape.org. Simply add org.textrend.visualization.cytoscape_0.0.3.jar into your /plugin directory. Restart Sci2 Tool. Cytoscape now shows in the Visualization Menu. Select a network in Data Manager, run Cytoscape and the tool will start with this network loaded. 23
14:00 Welcome and Overview of Tutorial and Attendees 14:15 New Sci2 Functionality Horizontal Line Graphs Geomap with Gephi Network Overlay Adding a New Plugins, e.g., Cytoscape Optimizing the Menu System 15:15 Presentations by Participants 15:45 Q&A 16:00 Adjourn Tutorial Overview 25
CIShell – Customize Menu • The file ‘yourtooldirectory/configuration/default_menu.xml’ encodes the structure of the menu system. • In NWB Tool, the Modeling menu (left) is encoded by the following piece of xml code: Exercise: Add org.textrend.visualization.cytoscape to the “Visualization > Networks” panel in Sci2 (right under GUESS). 26
14:00 Welcome and Overview of Tutorial and Attendees 14:15 New Sci2 Functionality Horizontal Line Graphs Geomap with Gephi Network Overlay Adding a New Plugins, e.g., Cytoscape Optimizing the Menu System 15:15 Presentations by Participants 15:45 Q&A 16:00 Adjourn Tutorial Overview 27
If you enjoyed the tutorial, please thank Andrea Scharnhorst, Albert Meroño Peñuela, Jeannette Haagsma, Anja de Haas, Nick Jankowski, Sally Wyatt; US side: Chin Hua Kong, Joseph R. Biberstine, Samantha Hale There will be another Sci2 Tutorial for Science Policy Makers at the Institut für Forschungsinformation und Qualitätssicherung in Berlin, Germany on June 28, 2012. Q & A Bug reports and all comments are welcome. 28
All papers, maps, tools, talks, press are linked from http://cns.iu.edu CNS Facebook: http://www.facebook.com/cnscenter Mapping Science Exhibit Facebook: http://www.facebook.com/mappingscience


![Five Parts to this Chapter Temporal Acuity (critical flicker frequency [CFF])](https://cdn1.slideserve.com/3122999/slide1-dt.jpg)